
|
Shenzhen Heungkong Holding Co., Ltd (600162.SS) Évaluation DCF |
Entièrement Modifiable: Adapté À Vos Besoins Dans Excel Ou Sheets
Conception Professionnelle: Modèles Fiables Et Conformes Aux Normes Du Secteur
Pré-Construits Pour Une Utilisation Rapide Et Efficace
Compatible MAC/PC, entièrement débloqué
Aucune Expertise N'Est Requise; Facile À Suivre
Shenzhen HeungKong Holding Co.,Ltd (600162.SS) Bundle
Découvrez la vraie valeur de Shenzhen Heungkong Holding Co., Ltd (600162SS) avec notre calculatrice avancée DCF! Ajustez les hypothèses clés, explorez divers scénarios et évaluez l'impact des changements sur l'évaluation de Shenzhen Heungkong Holding Co., Ltd (600162SS) - le tout dans un seul modèle Excel.
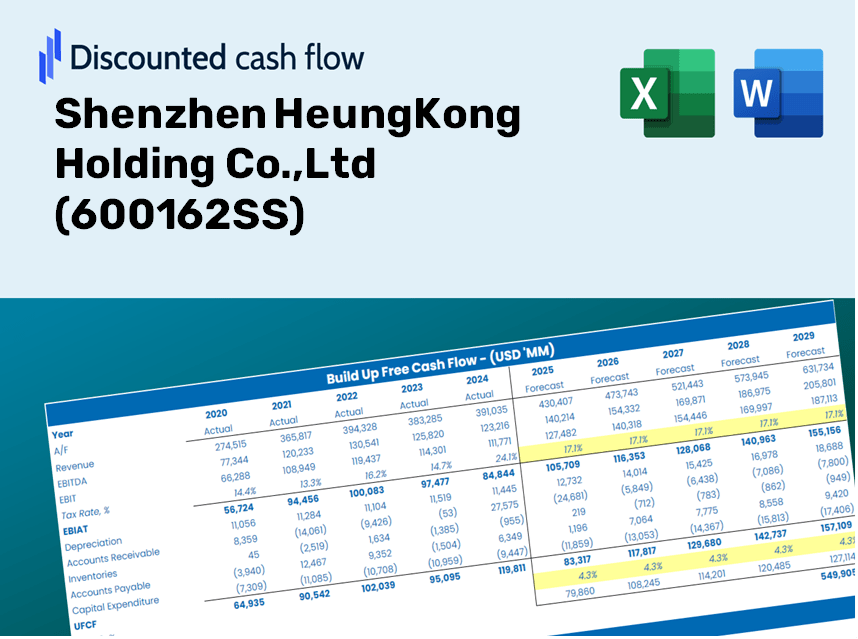
Discounted Cash Flow (DCF) - (USD MM)
| Year | AY1 2020 |
AY2 2021 |
AY3 2022 |
AY4 2023 |
AY5 2024 |
FY1 2025 |
FY2 2026 |
FY3 2027 |
FY4 2028 |
FY5 2029 |
|---|---|---|---|---|---|---|---|---|---|---|
| Revenue | 4,982.2 | 5,704.3 | 6,054.7 | 3,299.6 | 3,760.3 | 3,657.8 | 3,558.0 | 3,461.0 | 3,366.7 | 3,274.9 |
| Revenue Growth, % | 0 | 14.5 | 6.14 | -45.5 | 13.96 | -2.73 | -2.73 | -2.73 | -2.73 | -2.73 |
| EBITDA | 1,086.5 | 1,147.3 | 1,106.5 | 766.3 | 520.7 | 711.6 | 692.2 | 673.3 | 654.9 | 637.1 |
| EBITDA, % | 21.81 | 20.11 | 18.28 | 23.22 | 13.85 | 19.45 | 19.45 | 19.45 | 19.45 | 19.45 |
| Depreciation | 147.9 | 308.5 | 306.8 | 274.4 | 253.8 | 208.6 | 202.9 | 197.3 | 192.0 | 186.7 |
| Depreciation, % | 2.97 | 5.41 | 5.07 | 8.31 | 6.75 | 5.7 | 5.7 | 5.7 | 5.7 | 5.7 |
| EBIT | 938.6 | 838.8 | 799.8 | 492.0 | 266.8 | 503.0 | 489.3 | 476.0 | 463.0 | 450.4 |
| EBIT, % | 18.84 | 14.71 | 13.21 | 14.91 | 7.1 | 13.75 | 13.75 | 13.75 | 13.75 | 13.75 |
| Total Cash | 3,702.4 | 3,564.4 | 3,252.2 | 1,568.7 | 1,124.7 | 1,960.3 | 1,906.9 | 1,854.9 | 1,804.3 | 1,755.1 |
| Total Cash, percent | .0 | .0 | .0 | .0 | .0 | .0 | .0 | .0 | .0 | .0 |
| Account Receivables | 1,152.7 | 2,599.6 | 1,387.8 | 731.8 | 400.2 | 910.4 | 885.6 | 861.5 | 838.0 | 815.1 |
| Account Receivables, % | 23.14 | 45.57 | 22.92 | 22.18 | 10.64 | 24.89 | 24.89 | 24.89 | 24.89 | 24.89 |
| Inventories | 14,744.3 | 15,860.7 | 12,670.2 | 11,404.8 | 9,301.3 | 3,657.8 | 3,558.0 | 3,461.0 | 3,366.7 | 3,274.9 |
| Inventories, % | 295.94 | 278.05 | 209.26 | 345.64 | 247.36 | 100 | 100 | 100 | 100 | 100 |
| Accounts Payable | 3,781.7 | 3,697.7 | 3,746.5 | 3,149.0 | 2,668.3 | 2,699.4 | 2,625.8 | 2,554.2 | 2,484.6 | 2,416.9 |
| Accounts Payable, % | 75.9 | 64.82 | 61.88 | 95.44 | 70.96 | 73.8 | 73.8 | 73.8 | 73.8 | 73.8 |
| Capital Expenditure | -114.2 | -210.3 | -68.9 | -43.5 | -88.0 | -78.8 | -76.7 | -74.6 | -72.6 | -70.6 |
| Capital Expenditure, % | -2.29 | -3.69 | -1.14 | -1.32 | -2.34 | -2.16 | -2.16 | -2.16 | -2.16 | -2.16 |
| Tax Rate, % | -713.12 | -713.12 | -713.12 | -713.12 | -713.12 | -713.12 | -713.12 | -713.12 | -713.12 | -713.12 |
| EBITAT | 458.4 | 422.2 | 485.7 | 159.3 | 2,169.7 | 294.0 | 286.0 | 278.2 | 270.6 | 263.3 |
| Depreciation | ||||||||||
| Changes in Account Receivables | ||||||||||
| Changes in Inventories | ||||||||||
| Changes in Accounts Payable | ||||||||||
| Capital Expenditure | ||||||||||
| UFCF | -11,623.1 | -2,126.9 | 5,174.8 | 1,713.8 | 4,289.9 | 5,588.2 | 463.2 | 450.5 | 438.2 | 426.3 |
| WACC, % | 5.75 | 5.79 | 6.06 | 5.31 | 7.1 | 6 | 6 | 6 | 6 | 6 |
| PV UFCF | ||||||||||
| SUM PV UFCF | 6,727.8 | |||||||||
| Long Term Growth Rate, % | 2.00 | |||||||||
| Free cash flow (T + 1) | 435 | |||||||||
| Terminal Value | 10,863 | |||||||||
| Present Terminal Value | 8,117 | |||||||||
| Enterprise Value | 14,844 | |||||||||
| Net Debt | 1,739 | |||||||||
| Equity Value | 13,105 | |||||||||
| Diluted Shares Outstanding, MM | 3,270 | |||||||||
| Equity Value Per Share | 4.01 |
What You Will Receive
- Accurate 600162SS Financials: Access to both historical and projected data for precise valuation.
- Customizable Inputs: Adjust WACC, tax rates, revenue growth, and capital expenditures as needed.
- Real-Time Calculations: Intrinsic value and NPV are computed instantly.
- Scenario Analysis: Explore various scenarios to assess Shenzhen HeungKong Holding Co., Ltd's future potential.
- User-Friendly Design: Tailored for industry professionals while remaining approachable for newcomers.
Key Features
- Comprehensive 600162SS Data: Pre-loaded with Shenzhen HeungKong Holding's historical financial performance and future forecasts.
- Flexible Input Options: Customize revenue growth rates, profit margins, discount rates, tax levels, and capital investment plans.
- Interactive Valuation Model: Automatically refreshes Net Present Value (NPV) and intrinsic value based on your specified parameters.
- Multi-Scenario Analysis: Generate various forecast scenarios to explore diverse valuation possibilities.
- Intuitive Interface: Designed for ease of use, catering to both seasoned professionals and novices.
How It Works
- Step 1: Download the prebuilt Excel template featuring Shenzhen HeungKong Holding Co., Ltd's (600162SS) data.
- Step 2: Review the pre-populated sheets to familiarize yourself with the essential metrics.
- Step 3: Modify forecasts and assumptions in the editable yellow cells (WACC, growth, margins).
- Step 4: Instantly observe recalibrated results, including the intrinsic value of Shenzhen HeungKong Holding Co., Ltd (600162SS).
- Step 5: Make well-informed investment choices or create reports based on the results.
Why Choose This Calculator for Shenzhen HeungKong Holding Co.,Ltd (600162SS)?
- User-Friendly Interface: Crafted for both novice users and seasoned professionals.
- Customizable Inputs: Adjust variables effortlessly to suit your financial analysis.
- Real-Time Adjustments: Observe immediate impacts on Shenzhen HeungKong's valuation as you change inputs.
- Preloaded Financial Data: Comes with Shenzhen HeungKong's actual financial figures for swift evaluations.
- Preferred by Industry Experts: A go-to tool for investors and analysts to support informed decision-making.
Who Can Benefit from This Product?
- Institutional Investors: Create comprehensive and precise valuation models for portfolio assessment of Shenzhen HeungKong Holding Co., Ltd (600162SS).
- Corporate Finance Departments: Evaluate valuation scenarios to inform strategic decisions within the organization.
- Advisors and Consultants: Equip clients with reliable valuation metrics for Shenzhen HeungKong Holding Co., Ltd (600162SS).
- Academics and Students: Leverage real-world data to enhance learning and practical application of financial modeling techniques.
- Market Analysts: Gain insights into how companies like Shenzhen HeungKong Holding Co., Ltd (600162SS) are valued in the competitive landscape.
Contents of the Template
- Operating and Balance Sheet Data: Pre-filled historical data and forecasts for Shenzhen HeungKong Holding Co., Ltd (600162SS), including metrics such as revenue, EBITDA, EBIT, and capital expenditures.
- WACC Calculation: A dedicated sheet for calculating the Weighted Average Cost of Capital (WACC), featuring inputs like Beta, risk-free rate, and share price.
- DCF Valuation (Unlevered and Levered): Customizable Discounted Cash Flow models that detail intrinsic value alongside comprehensive calculations.
- Financial Statements: Pre-loaded annual and quarterly financial statements for in-depth analysis.
- Key Ratios: A collection of profitability, leverage, and efficiency ratios specific to Shenzhen HeungKong Holding Co., Ltd (600162SS).
- Dashboard and Charts: A visual overview of valuation outputs and assumptions, facilitating easy analysis of results.
Disclaimer
All information, articles, and product details provided on this website are for general informational and educational purposes only. We do not claim any ownership over, nor do we intend to infringe upon, any trademarks, copyrights, logos, brand names, or other intellectual property mentioned or depicted on this site. Such intellectual property remains the property of its respective owners, and any references here are made solely for identification or informational purposes, without implying any affiliation, endorsement, or partnership.
We make no representations or warranties, express or implied, regarding the accuracy, completeness, or suitability of any content or products presented. Nothing on this website should be construed as legal, tax, investment, financial, medical, or other professional advice. In addition, no part of this site—including articles or product references—constitutes a solicitation, recommendation, endorsement, advertisement, or offer to buy or sell any securities, franchises, or other financial instruments, particularly in jurisdictions where such activity would be unlawful.
All content is of a general nature and may not address the specific circumstances of any individual or entity. It is not a substitute for professional advice or services. Any actions you take based on the information provided here are strictly at your own risk. You accept full responsibility for any decisions or outcomes arising from your use of this website and agree to release us from any liability in connection with your use of, or reliance upon, the content or products found herein.