
|
Beiqi Foton Motor Co., Ltd. (600166.SS) Évaluation DCF |
Entièrement Modifiable: Adapté À Vos Besoins Dans Excel Ou Sheets
Conception Professionnelle: Modèles Fiables Et Conformes Aux Normes Du Secteur
Pré-Construits Pour Une Utilisation Rapide Et Efficace
Compatible MAC/PC, entièrement débloqué
Aucune Expertise N'Est Requise; Facile À Suivre
Beiqi Foton Motor Co., Ltd. (600166.SS) Bundle
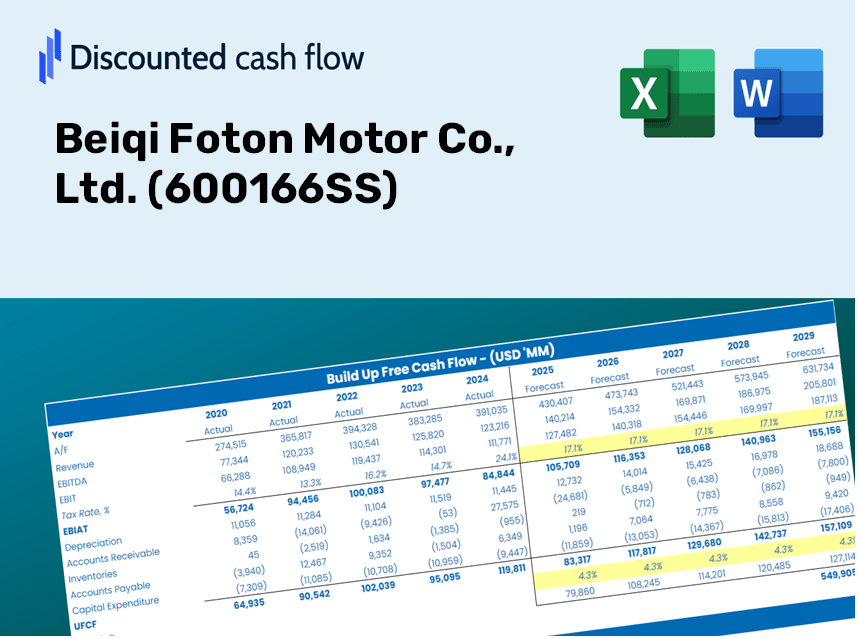
Simplifier Beiqi Foton Motor Co., Ltd. (600166SS) Valation avec cette calculatrice DCF personnalisable! Doté de Real Beiqi Foton Motor Co., Ltd. (600166SS) Financials and Adjustable Prévisions, vous pouvez tester des scénarios et découvrir Beiqi Foton Motor Co., Ltd. (600166SS) juste Value en quelques minutes.
What You Will Receive
- Genuine Beiqi Foton Data: Comprehensive financial information – covering everything from revenue to EBIT – based on real and projected metrics.
- Complete Customization: Modify all essential parameters (yellow cells) such as WACC, growth %, and tax rates to fit your analysis.
- Instant Valuation Adjustments: Automatic recalculations to assess how changes affect the fair value of Beiqi Foton (600166SS).
- Flexible Excel Template: Designed for easy edits, scenario analysis, and detailed forecasting.
- Efficient and Precise: Eliminate the need to create models from the ground up while ensuring accuracy and adaptability.
Key Features
- 🔍 Real-Life [Symbol] Financials: Access pre-filled historical and projected data for Beiqi Foton Motor Co., Ltd.
- ✏️ Fully Customizable Inputs: Modify essential parameters (yellow cells) such as WACC, growth %, and tax rates.
- 📊 Professional DCF Valuation: Utilize built-in formulas to determine Beiqi Foton's intrinsic value through the Discounted Cash Flow method.
- ⚡ Instant Results: Instantly visualize Beiqi Foton's valuation after making any modifications.
- Scenario Analysis: Evaluate and contrast outcomes for different financial assumptions side-by-side.
How It Works
- Step 1: Download the prebuilt Excel template featuring Beiqi Foton Motor Co., Ltd.'s data.
- Step 2: Navigate through the pre-filled sheets to familiarize yourself with the essential metrics.
- Step 3: Modify forecasts and assumptions in the adjustable yellow cells (WACC, growth, margins).
- Step 4: Instantly see the recalculated outcomes, including the intrinsic value of Beiqi Foton Motor Co., Ltd. (600166SS).
- Step 5: Use the results to make well-informed investment decisions or create comprehensive reports.
Why Opt for This Calculator?
- Designed for Experts: A sophisticated tool utilized by analysts, CFOs, and industry consultants.
- Accurate Data: Beiqi Foton Motor Co., Ltd.’s (600166SS) historical and forecasted financials are preloaded for precision.
- Scenario Simulation: Effortlessly test various projections and assumptions.
- Comprehensive Outputs: Automatically calculates intrinsic value, NPV, and essential metrics.
- User-Friendly: Detailed instructions walk you through every step of the process.
Who Should Utilize This Product?
- Institutional Investors: Create comprehensive and trustworthy valuation models for assessing portfolios in Beiqi Foton Motor Co., Ltd. (600166SS).
- Corporate Finance Teams: Evaluate valuation scenarios to inform internal decision-making strategies.
- Consultants and Advisors: Deliver accurate valuation insights related to Beiqi Foton Motor Co., Ltd. (600166SS) for their clients.
- Students and Educators: Leverage real-world data to practice and teach financial modeling concepts.
- Automotive Industry Enthusiasts: Gain insights into how companies like Beiqi Foton Motor Co., Ltd. (600166SS) are valued within the market.
What the Template Contains
- Historical Data: Comprehensive overview of Beiqi Foton Motor Co., Ltd.'s past financial performance and baseline projections.
- DCF and Levered DCF Models: Detailed templates designed to assess the intrinsic value of Beiqi Foton Motor Co., Ltd. (600166SS).
- WACC Sheet: Predefined calculations for the Weighted Average Cost of Capital.
- Editable Inputs: Modify essential drivers such as growth rates, EBITDA percentages, and CAPEX estimations.
- Quarterly and Annual Statements: A thorough analysis of Beiqi Foton Motor Co., Ltd.'s financial statements.
- Interactive Dashboard: Dynamic visualization of valuation outcomes and forecasts.
Disclaimer
All information, articles, and product details provided on this website are for general informational and educational purposes only. We do not claim any ownership over, nor do we intend to infringe upon, any trademarks, copyrights, logos, brand names, or other intellectual property mentioned or depicted on this site. Such intellectual property remains the property of its respective owners, and any references here are made solely for identification or informational purposes, without implying any affiliation, endorsement, or partnership.
We make no representations or warranties, express or implied, regarding the accuracy, completeness, or suitability of any content or products presented. Nothing on this website should be construed as legal, tax, investment, financial, medical, or other professional advice. In addition, no part of this site—including articles or product references—constitutes a solicitation, recommendation, endorsement, advertisement, or offer to buy or sell any securities, franchises, or other financial instruments, particularly in jurisdictions where such activity would be unlawful.
All content is of a general nature and may not address the specific circumstances of any individual or entity. It is not a substitute for professional advice or services. Any actions you take based on the information provided here are strictly at your own risk. You accept full responsibility for any decisions or outcomes arising from your use of this website and agree to release us from any liability in connection with your use of, or reliance upon, the content or products found herein.