
|
Zhejiang Hisun Pharmaceutical Co., Ltd. (600267.SS) Évaluation DCF |
Entièrement Modifiable: Adapté À Vos Besoins Dans Excel Ou Sheets
Conception Professionnelle: Modèles Fiables Et Conformes Aux Normes Du Secteur
Pré-Construits Pour Une Utilisation Rapide Et Efficace
Compatible MAC/PC, entièrement débloqué
Aucune Expertise N'Est Requise; Facile À Suivre
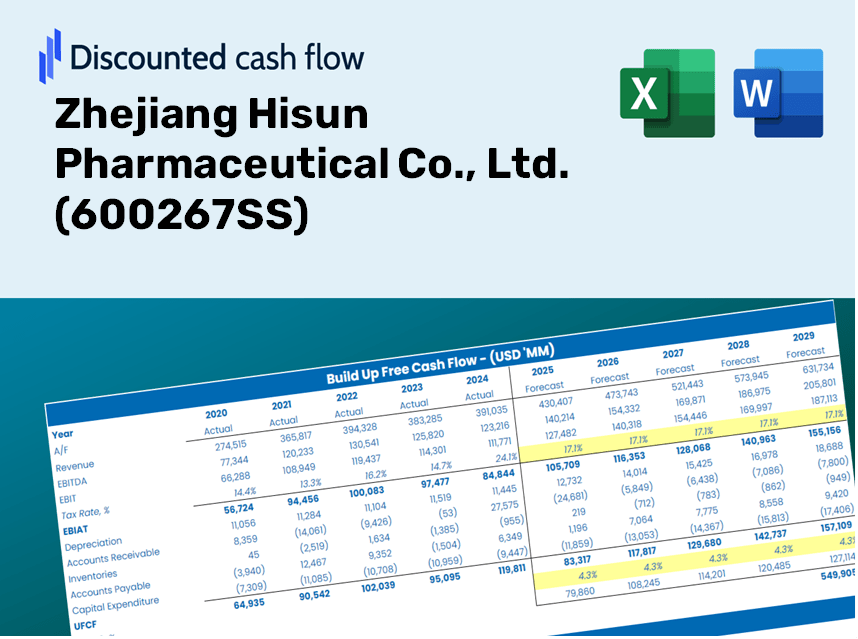
Zhejiang Hisun Pharmaceutical Co., Ltd. (600267.SS) Bundle
Simplifier Zhejiang Hisun Pharmaceutical Co., Ltd. (600267SS) Valation avec cette calculatrice DCF personnalisable! Doté de Real Zhejiang Hisun Pharmaceutical Co., Ltd. (600267SS) Financials and Adjustable Prévisions, vous pouvez tester des scénarios et découvrir le zhejiang Hisun Pharmaceutical Co., Ltd. (600267SS) juste une valeur juste en minutes.
Discounted Cash Flow (DCF) - (USD MM)
| Year | AY1 2020 |
AY2 2021 |
AY3 2022 |
AY4 2023 |
AY5 2024 |
FY1 2025 |
FY2 2026 |
FY3 2027 |
FY4 2028 |
FY5 2029 |
|---|---|---|---|---|---|---|---|---|---|---|
| Revenue | 11,354.4 | 12,136.5 | 12,036.7 | 10,373.1 | 9,786.8 | 9,458.8 | 9,141.8 | 8,835.4 | 8,539.2 | 8,253.0 |
| Revenue Growth, % | 0 | 6.89 | -0.82211 | -13.82 | -5.65 | -3.35 | -3.35 | -3.35 | -3.35 | -3.35 |
| EBITDA | 2,199.2 | 1,941.7 | 2,006.5 | 1,180.3 | 1,952.4 | 1,577.1 | 1,524.2 | 1,473.1 | 1,423.8 | 1,376.0 |
| EBITDA, % | 19.37 | 16 | 16.67 | 11.38 | 19.95 | 16.67 | 16.67 | 16.67 | 16.67 | 16.67 |
| Depreciation | 881.3 | 954.3 | 1,045.5 | 1,044.6 | 1,087.4 | 860.6 | 831.8 | 803.9 | 776.9 | 750.9 |
| Depreciation, % | 7.76 | 7.86 | 8.69 | 10.07 | 11.11 | 9.1 | 9.1 | 9.1 | 9.1 | 9.1 |
| EBIT | 1,317.9 | 987.4 | 961.0 | 135.7 | 865.0 | 716.5 | 692.5 | 669.2 | 646.8 | 625.1 |
| EBIT, % | 11.61 | 8.14 | 7.98 | 1.31 | 8.84 | 7.57 | 7.57 | 7.57 | 7.57 | 7.57 |
| Total Cash | 2,059.4 | 1,298.8 | 1,398.8 | 1,586.9 | 1,497.6 | 1,344.3 | 1,299.3 | 1,255.7 | 1,213.6 | 1,172.9 |
| Total Cash, percent | .0 | .0 | .0 | .0 | .0 | .0 | .0 | .0 | .0 | .0 |
| Account Receivables | 1,918.4 | 2,239.0 | 2,802.1 | 2,066.1 | 2,121.8 | 1,896.0 | 1,832.4 | 1,771.0 | 1,711.6 | 1,654.3 |
| Account Receivables, % | 16.9 | 18.45 | 23.28 | 19.92 | 21.68 | 20.04 | 20.04 | 20.04 | 20.04 | 20.04 |
| Inventories | 2,564.8 | 2,022.9 | 1,914.1 | 1,956.9 | 1,794.7 | 1,747.3 | 1,688.7 | 1,632.1 | 1,577.4 | 1,524.5 |
| Inventories, % | 22.59 | 16.67 | 15.9 | 18.86 | 18.34 | 18.47 | 18.47 | 18.47 | 18.47 | 18.47 |
| Accounts Payable | 1,620.4 | 1,320.6 | 1,530.2 | 1,144.5 | 1,224.5 | 1,161.8 | 1,122.8 | 1,085.2 | 1,048.8 | 1,013.7 |
| Accounts Payable, % | 14.27 | 10.88 | 12.71 | 11.03 | 12.51 | 12.28 | 12.28 | 12.28 | 12.28 | 12.28 |
| Capital Expenditure | -692.0 | -622.4 | -530.6 | -240.0 | -238.4 | -385.6 | -372.7 | -360.2 | -348.1 | -336.4 |
| Capital Expenditure, % | -6.09 | -5.13 | -4.41 | -2.31 | -2.44 | -4.08 | -4.08 | -4.08 | -4.08 | -4.08 |
| Tax Rate, % | 16.28 | 16.28 | 16.28 | 16.28 | 16.28 | 16.28 | 16.28 | 16.28 | 16.28 | 16.28 |
| EBITAT | 1,054.1 | 746.3 | 687.4 | 152.6 | 724.2 | 588.7 | 568.9 | 549.9 | 531.4 | 513.6 |
| Depreciation | ||||||||||
| Changes in Account Receivables | ||||||||||
| Changes in Inventories | ||||||||||
| Changes in Accounts Payable | ||||||||||
| Capital Expenditure | ||||||||||
| UFCF | -1,619.4 | 999.8 | 957.5 | 1,264.7 | 1,759.7 | 1,274.2 | 1,111.2 | 1,074.0 | 1,038.0 | 1,003.2 |
| WACC, % | 5.26 | 5.21 | 5.17 | 5.46 | 5.29 | 5.28 | 5.28 | 5.28 | 5.28 | 5.28 |
| PV UFCF | ||||||||||
| SUM PV UFCF | 4,753.9 | |||||||||
| Long Term Growth Rate, % | 2.00 | |||||||||
| Free cash flow (T + 1) | 1,023 | |||||||||
| Terminal Value | 31,211 | |||||||||
| Present Terminal Value | 24,133 | |||||||||
| Enterprise Value | 28,887 | |||||||||
| Net Debt | 1,729 | |||||||||
| Equity Value | 27,158 | |||||||||
| Diluted Shares Outstanding, MM | 1,156 | |||||||||
| Equity Value Per Share | 23.49 |
Benefits You Will Receive
- Pre-Structured Financial Model: Utilize Zhejiang Hisun Pharmaceutical's actual data for accurate DCF valuation.
- Comprehensive Forecast Control: Modify key metrics like revenue growth, profit margins, WACC, and other essential drivers.
- Real-Time Calculations: Automatic updates provide immediate results as you adjust parameters.
- Professional-Grade Template: An expertly crafted Excel file ready for investor presentations.
- Flexible and Reusable: Designed for adaptability, allowing for repeated use in extensive forecasting.
Key Features
- Comprehensive Financial Data: Access precise pre-loaded historical performance and future forecasts for Zhejiang Hisun Pharmaceutical Co., Ltd. (600267SS).
- Adjustable Forecast Parameters: Modify highlighted fields such as discount rates, growth assumptions, and profit margins.
- Real-Time Calculations: Automatic refresh of DCF, Net Present Value (NPV), and cash flow assessments.
- User-Friendly Dashboard: Intuitive charts and summaries for easy visualization of your valuation outcomes.
- Suitable for All Experience Levels: A straightforward, user-friendly layout designed for investors, CFOs, and consultants alike.
How It Functions
- Download: Obtain the pre-prepared Excel file containing Zhejiang Hisun Pharmaceutical Co., Ltd.'s (600267SS) financial information.
- Customize: Modify forecasts such as revenue growth, EBITDA %, and WACC to fit your analysis.
- Auto-Update: The intrinsic value and NPV calculations refresh automatically as changes are made.
- Scenario Testing: Generate various projections and evaluate results instantly.
- Make Informed Choices: Leverage the valuation findings to shape your investment approach.
Why Opt for This Calculator?
- User-Friendly Interface: Crafted to cater to both novices and seasoned users.
- Customizable Inputs: Effortlessly adjust parameters to suit your analysis needs.
- Real-Time Feedback: Observe immediate shifts in Zhejiang Hisun Pharmaceutical Co., Ltd.'s valuation as you tweak inputs.
- Preloaded Data: Comes equipped with Zhejiang Hisun's actual financial figures for swift evaluations.
- Widely Endorsed: Favored by investors and analysts for making well-informed choices.
Who Should Utilize This Product?
- Pharmaceutical Students: Acquire knowledge in drug valuation methods and apply them using real-world data.
- Researchers: Integrate professional models into your academic projects or studies.
- Investors: Validate your hypotheses and evaluate valuation scenarios for Zhejiang Hisun Pharmaceutical Co., Ltd. (600267SS).
- Market Analysts: Enhance your efficiency with a customizable DCF model tailored for pharmaceutical evaluations.
- Entrepreneurs: Understand how large pharmaceutical firms like Zhejiang Hisun are assessed in the market.
What the Template Includes
- Pre-Filled Data: Contains Zhejiang Hisun Pharmaceutical Co., Ltd.'s historical financials and projections.
- Discounted Cash Flow Model: An editable DCF valuation model featuring automatic calculations.
- Weighted Average Cost of Capital (WACC): A specific worksheet for deriving WACC using tailored inputs.
- Key Financial Ratios: Evaluate Zhejiang Hisun's profitability, efficiency, and financial leverage.
- Customizable Inputs: Easily adjust revenue growth rates, profit margins, and tax rates.
- Clear Dashboard: Visual summaries of key valuation outcomes through charts and tables.
Disclaimer
All information, articles, and product details provided on this website are for general informational and educational purposes only. We do not claim any ownership over, nor do we intend to infringe upon, any trademarks, copyrights, logos, brand names, or other intellectual property mentioned or depicted on this site. Such intellectual property remains the property of its respective owners, and any references here are made solely for identification or informational purposes, without implying any affiliation, endorsement, or partnership.
We make no representations or warranties, express or implied, regarding the accuracy, completeness, or suitability of any content or products presented. Nothing on this website should be construed as legal, tax, investment, financial, medical, or other professional advice. In addition, no part of this site—including articles or product references—constitutes a solicitation, recommendation, endorsement, advertisement, or offer to buy or sell any securities, franchises, or other financial instruments, particularly in jurisdictions where such activity would be unlawful.
All content is of a general nature and may not address the specific circumstances of any individual or entity. It is not a substitute for professional advice or services. Any actions you take based on the information provided here are strictly at your own risk. You accept full responsibility for any decisions or outcomes arising from your use of this website and agree to release us from any liability in connection with your use of, or reliance upon, the content or products found herein.