
|
Chongqing Port Co., Ltd. (600279.SS) Évaluation DCF |
Entièrement Modifiable: Adapté À Vos Besoins Dans Excel Ou Sheets
Conception Professionnelle: Modèles Fiables Et Conformes Aux Normes Du Secteur
Pré-Construits Pour Une Utilisation Rapide Et Efficace
Compatible MAC/PC, entièrement débloqué
Aucune Expertise N'Est Requise; Facile À Suivre
Chongqing Port Co.,Ltd. (600279.SS) Bundle
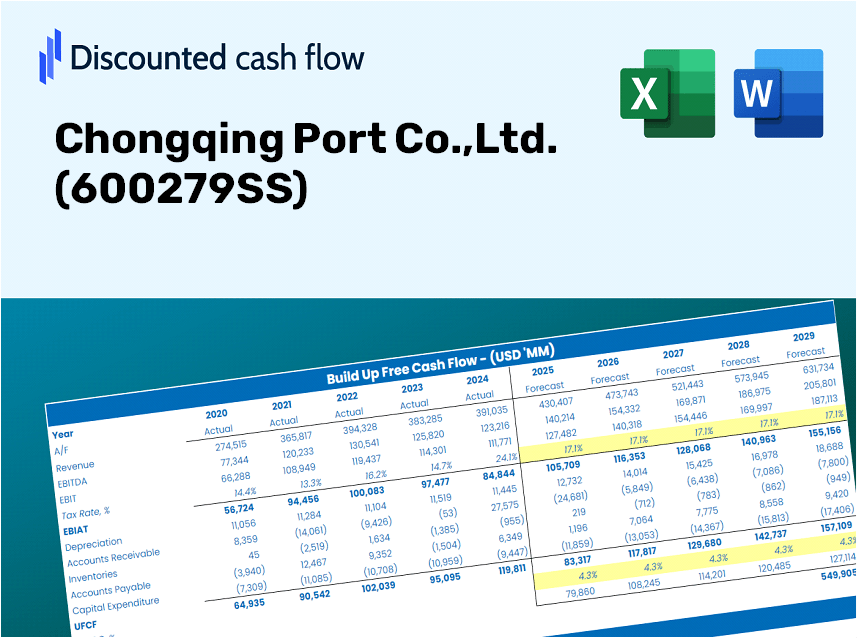
Découvrez le véritable potentiel de Chongqing Port Co., Ltd. (600279SS) avec notre calculatrice avancée DCF! Ajustez les hypothèses essentielles, explorez divers scénarios et évaluez comment différents facteurs influencent l'évaluation de Chongqing Port Co., Ltd. (600279SS) - le tout dans un modèle Excel complet.
Discounted Cash Flow (DCF) - (USD MM)
| Year | AY1 2020 |
AY2 2021 |
AY3 2022 |
AY4 2023 |
AY5 2024 |
FY1 2025 |
FY2 2026 |
FY3 2027 |
FY4 2028 |
FY5 2029 |
|---|---|---|---|---|---|---|---|---|---|---|
| Revenue | 5,080.6 | 5,481.8 | 4,961.5 | 4,948.9 | 4,377.0 | 4,230.3 | 4,088.6 | 3,951.6 | 3,819.1 | 3,691.1 |
| Revenue Growth, % | 0 | 7.9 | -9.49 | -0.25444 | -11.56 | -3.35 | -3.35 | -3.35 | -3.35 | -3.35 |
| EBITDA | 509.4 | 519.0 | 636.3 | 1,783.0 | 1,668.4 | 900.8 | 870.6 | 841.4 | 813.2 | 785.9 |
| EBITDA, % | 10.03 | 9.47 | 12.82 | 36.03 | 38.12 | 21.29 | 21.29 | 21.29 | 21.29 | 21.29 |
| Depreciation | 241.1 | 269.5 | 293.6 | 287.0 | 342.4 | 247.1 | 238.8 | 230.8 | 223.1 | 215.6 |
| Depreciation, % | 4.75 | 4.92 | 5.92 | 5.8 | 7.82 | 5.84 | 5.84 | 5.84 | 5.84 | 5.84 |
| EBIT | 268.3 | 249.4 | 342.7 | 1,496.1 | 1,326.0 | 653.7 | 631.8 | 610.6 | 590.1 | 570.4 |
| EBIT, % | 5.28 | 4.55 | 6.91 | 30.23 | 30.29 | 15.45 | 15.45 | 15.45 | 15.45 | 15.45 |
| Total Cash | 1,277.0 | 1,007.5 | 1,470.0 | 2,565.1 | 1,694.9 | 1,385.0 | 1,338.6 | 1,293.7 | 1,250.4 | 1,208.5 |
| Total Cash, percent | .0 | .0 | .0 | .0 | .0 | .0 | .0 | .0 | .0 | .0 |
| Account Receivables | 407.5 | 340.8 | 328.2 | 324.0 | 449.2 | 318.6 | 307.9 | 297.6 | 287.7 | 278.0 |
| Account Receivables, % | 8.02 | 6.22 | 6.61 | 6.55 | 10.26 | 7.53 | 7.53 | 7.53 | 7.53 | 7.53 |
| Inventories | 618.0 | 479.8 | 501.2 | 319.0 | 346.8 | 384.0 | 371.1 | 358.7 | 346.7 | 335.1 |
| Inventories, % | 12.16 | 8.75 | 10.1 | 6.45 | 7.92 | 9.08 | 9.08 | 9.08 | 9.08 | 9.08 |
| Accounts Payable | 276.7 | 361.4 | 340.3 | 449.5 | 512.6 | 335.8 | 324.6 | 313.7 | 303.2 | 293.0 |
| Accounts Payable, % | 5.45 | 6.59 | 6.86 | 9.08 | 11.71 | 7.94 | 7.94 | 7.94 | 7.94 | 7.94 |
| Capital Expenditure | -378.9 | -502.6 | -335.7 | -332.5 | -865.0 | -422.0 | -407.8 | -394.2 | -380.9 | -368.2 |
| Capital Expenditure, % | -7.46 | -9.17 | -6.77 | -6.72 | -19.76 | -9.97 | -9.97 | -9.97 | -9.97 | -9.97 |
| Tax Rate, % | 56 | 56 | 56 | 56 | 56 | 56 | 56 | 56 | 56 | 56 |
| EBITAT | 225.4 | 200.1 | 213.9 | 682.2 | 583.5 | 413.5 | 399.6 | 386.2 | 373.3 | 360.8 |
| Depreciation | ||||||||||
| Changes in Account Receivables | ||||||||||
| Changes in Inventories | ||||||||||
| Changes in Accounts Payable | ||||||||||
| Capital Expenditure | ||||||||||
| UFCF | -661.3 | 256.8 | 141.9 | 932.4 | -29.1 | 155.2 | 242.9 | 234.8 | 226.9 | 219.3 |
| WACC, % | 4.64 | 4.59 | 4.35 | 4.12 | 4.1 | 4.36 | 4.36 | 4.36 | 4.36 | 4.36 |
| PV UFCF | ||||||||||
| SUM PV UFCF | 946.8 | |||||||||
| Long Term Growth Rate, % | 2.00 | |||||||||
| Free cash flow (T + 1) | 224 | |||||||||
| Terminal Value | 9,482 | |||||||||
| Present Terminal Value | 7,660 | |||||||||
| Enterprise Value | 8,607 | |||||||||
| Net Debt | 1,330 | |||||||||
| Equity Value | 7,277 | |||||||||
| Diluted Shares Outstanding, MM | 1,176 | |||||||||
| Equity Value Per Share | 6.19 |
What You Will Receive
- Authentic Chongqing Port Data: Preloaded financial information – encompassing everything from revenue to EBIT – based on verified and projected statistics.
- Comprehensive Customization: Modify all essential parameters (yellow cells) such as WACC, growth %, and tax rates to suit your analysis.
- Instant Valuation Adjustments: Automatic recalculations to assess the effects of modifications on Chongqing Port’s fair value.
- Flexible Excel Template: Designed for quick edits, scenario analysis, and detailed forecasting.
- Efficiency and Accuracy: Eliminate the need to construct models from the ground up while ensuring precision and adaptability.
Highlighted Features
- Customizable Forecast Inputs: Adjust essential parameters such as revenue growth, EBITDA %, and capital expenditures.
- Instant DCF Valuation: Automatically computes intrinsic value, NPV, and additional metrics in real-time.
- High-Precision Accuracy: Leverages Chongqing Port Co., Ltd.'s (600279SS) actual financial performance for precise valuation results.
- Simplified Scenario Analysis: Easily evaluate various assumptions and analyze different outcomes.
- Efficiency Enhancer: Streamline the valuation process without the need to create intricate models from the ground up.
How It Works
- Step 1: Download the Excel spreadsheet.
- Step 2: Examine the pre-filled data for Chongqing Port Co., Ltd. (600279SS) (historical and projected).
- Step 3: Modify the key assumptions (highlighted in yellow) according to your analysis.
- Step 4: Observe the automatic updates for the intrinsic value of Chongqing Port Co., Ltd. (600279SS).
- Step 5: Utilize the results for your investment strategies or reporting needs.
Why Opt for This Calculator?
- Designed for Industry Experts: A sophisticated tool favored by analysts, CFOs, and consultants.
- Accurate Financial Insights: Preloaded historical and projected financial data for Chongqing Port Co., Ltd. (600279SS).
- Versatile Scenario Simulations: Effortlessly model various forecasts and assumptions.
- Comprehensive Results: Automatically computes intrinsic value, NPV, and essential metrics.
- User-Friendly: Detailed step-by-step guidance ensures a seamless experience.
Who Can Benefit from This Product?
- Investors: Make informed decisions by accurately estimating the fair value of Chongqing Port Co., Ltd. (600279SS).
- CFOs: Utilize a professional-grade DCF model for comprehensive financial reporting and analysis.
- Consultants: Effortlessly customize the template for client valuation reports.
- Entrepreneurs: Acquire valuable insights into financial modeling practices used by leading companies.
- Educators: Employ it as a teaching resource to illustrate various valuation methodologies.
Contents of the Template
- Historical Data: Encompasses Chongqing Port Co., Ltd.'s past financial performance and baseline forecasts.
- DCF and Levered DCF Models: Comprehensive templates designed to assess the intrinsic value of Chongqing Port Co., Ltd. (600279SS).
- WACC Sheet: Pre-constructed calculations for the Weighted Average Cost of Capital.
- Editable Inputs: Customize essential parameters such as growth rates, EBITDA %, and CAPEX assumptions.
- Quarterly and Annual Statements: A thorough analysis of Chongqing Port Co., Ltd.'s financials.
- Interactive Dashboard: Dynamically visualize valuation outcomes and forecasts.
Disclaimer
All information, articles, and product details provided on this website are for general informational and educational purposes only. We do not claim any ownership over, nor do we intend to infringe upon, any trademarks, copyrights, logos, brand names, or other intellectual property mentioned or depicted on this site. Such intellectual property remains the property of its respective owners, and any references here are made solely for identification or informational purposes, without implying any affiliation, endorsement, or partnership.
We make no representations or warranties, express or implied, regarding the accuracy, completeness, or suitability of any content or products presented. Nothing on this website should be construed as legal, tax, investment, financial, medical, or other professional advice. In addition, no part of this site—including articles or product references—constitutes a solicitation, recommendation, endorsement, advertisement, or offer to buy or sell any securities, franchises, or other financial instruments, particularly in jurisdictions where such activity would be unlawful.
All content is of a general nature and may not address the specific circumstances of any individual or entity. It is not a substitute for professional advice or services. Any actions you take based on the information provided here are strictly at your own risk. You accept full responsibility for any decisions or outcomes arising from your use of this website and agree to release us from any liability in connection with your use of, or reliance upon, the content or products found herein.