
|
Inner Mongolia Erdos Resources Co., Ltd. (600295.SS) Évaluation DCF |
Entièrement Modifiable: Adapté À Vos Besoins Dans Excel Ou Sheets
Conception Professionnelle: Modèles Fiables Et Conformes Aux Normes Du Secteur
Pré-Construits Pour Une Utilisation Rapide Et Efficace
Compatible MAC/PC, entièrement débloqué
Aucune Expertise N'Est Requise; Facile À Suivre
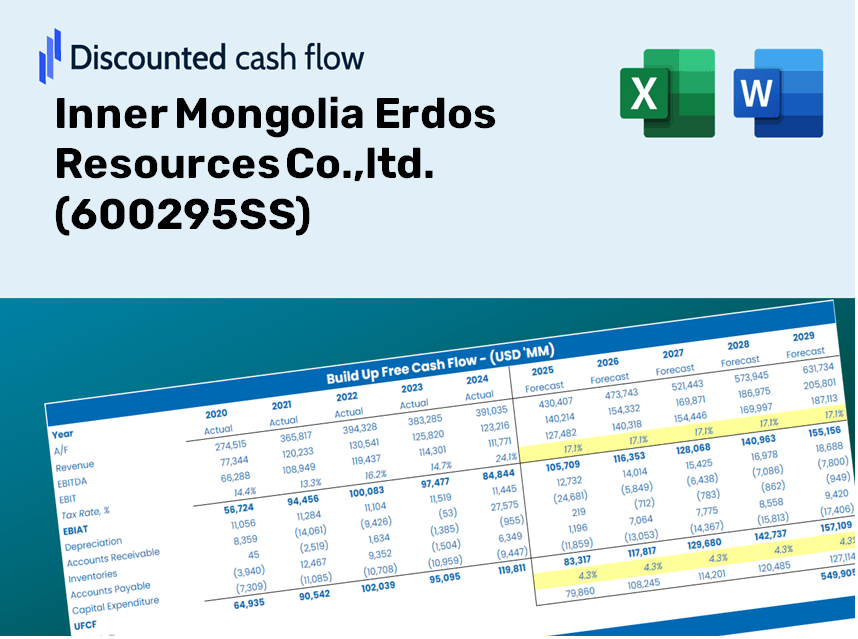
Inner Mongolia Erdos Resources Co.,ltd. (600295.SS) Bundle
Conçu pour la précision, notre (600295SS) La calculatrice DCF vous permet d'évaluer l'évaluation de l'intérieur de Mongolia Erdos Resources Co., Ltd. à l'aide de données financières réelles, offrant une flexibilité complète pour modifier tous les paramètres essentiels pour des projections améliorées.
Discounted Cash Flow (DCF) - (USD MM)
| Year | AY1 2020 |
AY2 2021 |
AY3 2022 |
AY4 2023 |
AY5 2024 |
FY1 2025 |
FY2 2026 |
FY3 2027 |
FY4 2028 |
FY5 2029 |
|---|---|---|---|---|---|---|---|---|---|---|
| Revenue | 23,141.2 | 36,473.3 | 36,393.4 | 30,553.6 | 28,403.5 | 29,025.5 | 29,661.3 | 30,310.9 | 30,974.7 | 31,653.1 |
| Revenue Growth, % | 0 | 57.61 | -0.21901 | -16.05 | -7.04 | 2.19 | 2.19 | 2.19 | 2.19 | 2.19 |
| EBITDA | 5,803.4 | 11,721.7 | 9,513.3 | 5,982.4 | 4,738.9 | 6,944.1 | 7,096.2 | 7,251.6 | 7,410.4 | 7,572.7 |
| EBITDA, % | 25.08 | 32.14 | 26.14 | 19.58 | 16.68 | 23.92 | 23.92 | 23.92 | 23.92 | 23.92 |
| Depreciation | 2,411.7 | 2,734.9 | 2,897.3 | 2,436.1 | 2,566.1 | 2,489.7 | 2,544.3 | 2,600.0 | 2,656.9 | 2,715.1 |
| Depreciation, % | 10.42 | 7.5 | 7.96 | 7.97 | 9.03 | 8.58 | 8.58 | 8.58 | 8.58 | 8.58 |
| EBIT | 3,391.7 | 8,986.8 | 6,616.1 | 3,546.3 | 2,172.8 | 4,454.4 | 4,551.9 | 4,651.6 | 4,753.5 | 4,857.6 |
| EBIT, % | 14.66 | 24.64 | 18.18 | 11.61 | 7.65 | 15.35 | 15.35 | 15.35 | 15.35 | 15.35 |
| Total Cash | 7,992.4 | 6,761.4 | 5,490.3 | 5,910.6 | 7,258.9 | 6,563.4 | 6,707.2 | 6,854.1 | 7,004.2 | 7,157.6 |
| Total Cash, percent | .0 | .0 | .0 | .0 | .0 | .0 | .0 | .0 | .0 | .0 |
| Account Receivables | 4,451.6 | 5,100.1 | 2,508.9 | 2,701.7 | 1,994.0 | 3,249.5 | 3,320.7 | 3,393.4 | 3,467.7 | 3,543.7 |
| Account Receivables, % | 19.24 | 13.98 | 6.89 | 8.84 | 7.02 | 11.2 | 11.2 | 11.2 | 11.2 | 11.2 |
| Inventories | 3,259.6 | 4,489.6 | 4,243.5 | 3,923.4 | 3,723.8 | 3,715.7 | 3,797.0 | 3,880.2 | 3,965.2 | 4,052.0 |
| Inventories, % | 14.09 | 12.31 | 11.66 | 12.84 | 13.11 | 12.8 | 12.8 | 12.8 | 12.8 | 12.8 |
| Accounts Payable | 7,237.9 | 4,979.6 | 7,253.2 | 10,553.0 | 11,440.7 | 8,108.5 | 8,286.1 | 8,467.5 | 8,653.0 | 8,842.5 |
| Accounts Payable, % | 31.28 | 13.65 | 19.93 | 34.54 | 40.28 | 27.94 | 27.94 | 27.94 | 27.94 | 27.94 |
| Capital Expenditure | -320.7 | -711.7 | -3,403.5 | -906.4 | -920.6 | -1,097.0 | -1,121.0 | -1,145.6 | -1,170.7 | -1,196.3 |
| Capital Expenditure, % | -1.39 | -1.95 | -9.35 | -2.97 | -3.24 | -3.78 | -3.78 | -3.78 | -3.78 | -3.78 |
| Tax Rate, % | 22.99 | 22.99 | 22.99 | 22.99 | 22.99 | 22.99 | 22.99 | 22.99 | 22.99 | 22.99 |
| EBITAT | 2,046.6 | 5,713.6 | 3,933.4 | 2,465.3 | 1,673.2 | 2,938.9 | 3,003.3 | 3,069.1 | 3,136.3 | 3,205.0 |
| Depreciation | ||||||||||
| Changes in Account Receivables | ||||||||||
| Changes in Inventories | ||||||||||
| Changes in Accounts Payable | ||||||||||
| Capital Expenditure | ||||||||||
| UFCF | 3,664.2 | 3,600.0 | 8,538.1 | 7,422.0 | 5,113.6 | -247.8 | 4,451.6 | 4,549.1 | 4,648.7 | 4,750.5 |
| WACC, % | 6.1 | 6.12 | 6.09 | 6.15 | 6.2 | 6.13 | 6.13 | 6.13 | 6.13 | 6.13 |
| PV UFCF | ||||||||||
| SUM PV UFCF | 14,716.1 | |||||||||
| Long Term Growth Rate, % | 0.50 | |||||||||
| Free cash flow (T + 1) | 4,774 | |||||||||
| Terminal Value | 84,787 | |||||||||
| Present Terminal Value | 62,968 | |||||||||
| Enterprise Value | 77,684 | |||||||||
| Net Debt | -1,551 | |||||||||
| Equity Value | 79,235 | |||||||||
| Diluted Shares Outstanding, MM | 2,799 | |||||||||
| Equity Value Per Share | 28.31 |
Benefits You'll Receive
- Pre-Filled Financial Model: Utilize Erdos Resources' actual data for accurate DCF valuation.
- Comprehensive Forecast Control: Modify revenue growth, profit margins, WACC, and other critical metrics.
- Real-Time Calculations: Automatic updates provide immediate insights as adjustments are made.
- Professional-Grade Template: An expertly crafted Excel file tailored for high-quality valuation.
- Flexible and Reusable: Designed for adaptability, enabling multiple uses for detailed projections.
Key Features
- Authentic Financial Data: Gain access to precise historical information and future forecasts for Inner Mongolia Erdos Resources Co., Ltd. (600295SS).
- Adjustable Forecast Parameters: Modify the yellow-highlighted cells for variables like WACC, growth rates, and profit margins.
- Real-Time Calculations: Automatic updates to DCF, Net Present Value (NPV), and cash flow assessments.
- User-Friendly Dashboard: Clear charts and summaries to easily visualize your valuation outcomes.
- Designed for All Skill Levels: An intuitive layout suitable for investors, CFOs, and consultants alike.
How It Functions
- Obtain the Template: Gain immediate access to the Excel-based Inner Mongolia Erdos Resources Co., Ltd. (600295SS) DCF Calculator.
- Enter Your Assumptions: Modify the yellow-highlighted cells for growth rates, WACC, profit margins, and additional parameters.
- Real-Time Calculations: The model automatically refreshes to show the intrinsic value of Inner Mongolia Erdos Resources Co., Ltd. (600295SS).
- Explore Scenarios: Experiment with various assumptions to assess potential changes in valuation.
- Evaluate and Conclude: Utilize the outcomes to inform your investment or financial decisions.
Reasons to Choose Erdos Resources Calculator
- Time Efficient: Skip the hassle of building a DCF model from the ground up – it’s instantly available for use.
- Enhanced Accuracy: Utilize dependable financial data and formulas to minimize valuation errors.
- Completely Customizable: Modify the model to suit your specific assumptions and forecasts.
- Clear and Understandable: User-friendly charts and outputs simplify result analysis.
- Endorsed by Professionals: Crafted for experts who prioritize both precision and usability.
Who Should Use This Product?
- Individual Investors: Make informed choices regarding the purchase or sale of Inner Mongolia Erdos Resources Co., Ltd. (600295SS) shares.
- Financial Analysts: Enhance valuation workflows with well-prepared financial models tailored to Erdos Resources.
- Consultants: Provide clients with quick and accurate valuation insights for Inner Mongolia Erdos Resources Co., Ltd. (600295SS).
- Business Owners: Gain a deeper understanding of how major companies like Inner Mongolia Erdos Resources Co., Ltd. (600295SS) are valued to inform your own business strategies.
- Finance Students: Explore valuation methodologies using real-world data and cases related to Inner Mongolia Erdos Resources Co., Ltd. (600295SS).
Contents of the Template
- Operating and Balance Sheet Data: Pre-filled historical data and forecasts for Inner Mongolia Erdos Resources Co., Ltd. (600295SS), including revenue, EBITDA, EBIT, and capital expenditures.
- WACC Calculation: A specific sheet dedicated to calculating the Weighted Average Cost of Capital (WACC), incorporating elements such as Beta, risk-free rate, and stock price.
- DCF Valuation (Unlevered and Levered): Customizable Discounted Cash Flow models that present intrinsic value through comprehensive calculations.
- Financial Statements: Pre-loaded annual and quarterly financial statements to enhance analysis.
- Key Ratios: Provides profitability, leverage, and efficiency ratios relevant to Inner Mongolia Erdos Resources Co., Ltd. (600295SS).
- Dashboard and Charts: A visual overview of valuation outputs and assumptions to facilitate result analysis.
Disclaimer
All information, articles, and product details provided on this website are for general informational and educational purposes only. We do not claim any ownership over, nor do we intend to infringe upon, any trademarks, copyrights, logos, brand names, or other intellectual property mentioned or depicted on this site. Such intellectual property remains the property of its respective owners, and any references here are made solely for identification or informational purposes, without implying any affiliation, endorsement, or partnership.
We make no representations or warranties, express or implied, regarding the accuracy, completeness, or suitability of any content or products presented. Nothing on this website should be construed as legal, tax, investment, financial, medical, or other professional advice. In addition, no part of this site—including articles or product references—constitutes a solicitation, recommendation, endorsement, advertisement, or offer to buy or sell any securities, franchises, or other financial instruments, particularly in jurisdictions where such activity would be unlawful.
All content is of a general nature and may not address the specific circumstances of any individual or entity. It is not a substitute for professional advice or services. Any actions you take based on the information provided here are strictly at your own risk. You accept full responsibility for any decisions or outcomes arising from your use of this website and agree to release us from any liability in connection with your use of, or reliance upon, the content or products found herein.