
|
Guangxi Guidong Electric Power Co., Ltd. (600310.SS) Évaluation DCF |
Entièrement Modifiable: Adapté À Vos Besoins Dans Excel Ou Sheets
Conception Professionnelle: Modèles Fiables Et Conformes Aux Normes Du Secteur
Pré-Construits Pour Une Utilisation Rapide Et Efficace
Compatible MAC/PC, entièrement débloqué
Aucune Expertise N'Est Requise; Facile À Suivre
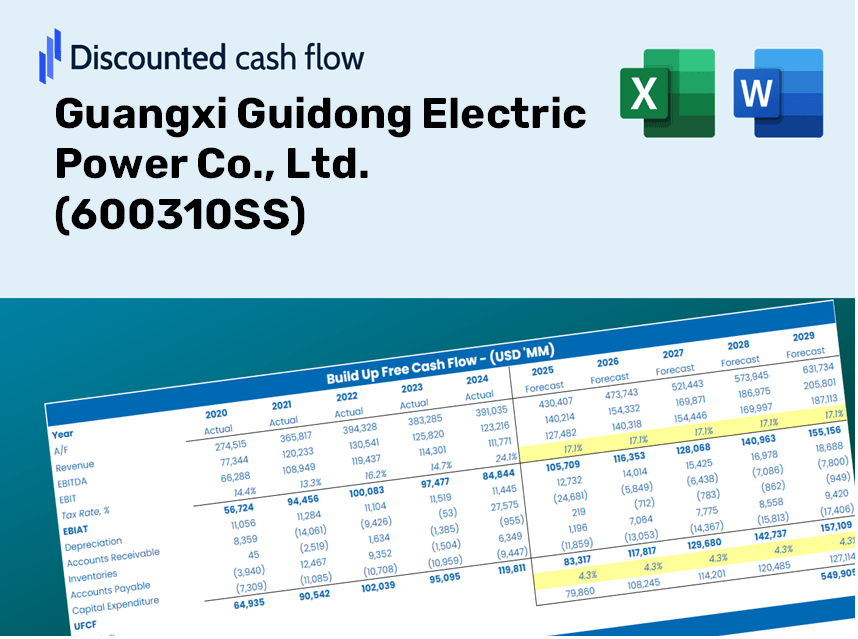
Guangxi Guidong Electric Power Co., Ltd. (600310.SS) Bundle
Conçu pour la précision, notre calculatrice DCF (600310SS) vous permet d'évaluer l'évaluation Guangxi Guidong Electric Power Co., Ltd. à l'aide de données financières réelles, ainsi qu'une flexibilité complète pour modifier tous les paramètres essentiels pour des prévisions améliorées.
Discounted Cash Flow (DCF) - (USD MM)
| Year | AY1 2020 |
AY2 2021 |
AY3 2022 |
AY4 2023 |
AY5 2024 |
FY1 2025 |
FY2 2026 |
FY3 2027 |
FY4 2028 |
FY5 2029 |
|---|---|---|---|---|---|---|---|---|---|---|
| Revenue | 18,753.7 | 17,080.0 | 17,434.8 | 16,662.6 | 3,931.6 | 3,069.8 | 2,396.9 | 1,871.5 | 1,461.3 | 1,140.9 |
| Revenue Growth, % | 0 | -8.92 | 2.08 | -4.43 | -76.4 | -21.92 | -21.92 | -21.92 | -21.92 | -21.92 |
| EBITDA | 1,087.9 | 1,214.1 | 1,091.6 | 1,191.7 | 1,443.4 | 387.0 | 302.2 | 235.9 | 184.2 | 143.8 |
| EBITDA, % | 5.8 | 7.11 | 6.26 | 7.15 | 36.71 | 12.61 | 12.61 | 12.61 | 12.61 | 12.61 |
| Depreciation | 363.9 | 534.1 | 644.8 | 643.2 | 620.3 | 174.4 | 136.2 | 106.3 | 83.0 | 64.8 |
| Depreciation, % | 1.94 | 3.13 | 3.7 | 3.86 | 15.78 | 5.68 | 5.68 | 5.68 | 5.68 | 5.68 |
| EBIT | 723.9 | 680.0 | 446.8 | 548.5 | 823.2 | 212.6 | 166.0 | 129.6 | 101.2 | 79.0 |
| EBIT, % | 3.86 | 3.98 | 2.56 | 3.29 | 20.94 | 6.93 | 6.93 | 6.93 | 6.93 | 6.93 |
| Total Cash | 2,205.6 | 2,730.0 | 2,817.1 | 1,662.1 | 2,105.7 | 659.6 | 515.0 | 402.1 | 314.0 | 245.2 |
| Total Cash, percent | .0 | .0 | .0 | .0 | .0 | .0 | .0 | .0 | .0 | .0 |
| Account Receivables | 633.1 | 974.6 | 1,342.5 | 700.7 | 951.7 | 277.5 | 216.6 | 169.2 | 132.1 | 103.1 |
| Account Receivables, % | 3.38 | 5.71 | 7.7 | 4.21 | 24.21 | 9.04 | 9.04 | 9.04 | 9.04 | 9.04 |
| Inventories | 1,759.6 | 1,521.4 | 1,790.7 | 215.3 | 203.7 | 215.1 | 167.9 | 131.1 | 102.4 | 79.9 |
| Inventories, % | 9.38 | 8.91 | 10.27 | 1.29 | 5.18 | 7.01 | 7.01 | 7.01 | 7.01 | 7.01 |
| Accounts Payable | 2,824.6 | 2,163.5 | 2,259.0 | 175.5 | 2,641.3 | 668.7 | 522.1 | 407.7 | 318.3 | 248.5 |
| Accounts Payable, % | 15.06 | 12.67 | 12.96 | 1.05 | 67.18 | 21.78 | 21.78 | 21.78 | 21.78 | 21.78 |
| Capital Expenditure | -1,126.4 | -920.8 | -380.8 | -1,908.2 | -3,650.2 | -723.7 | -565.1 | -441.2 | -344.5 | -269.0 |
| Capital Expenditure, % | -6.01 | -5.39 | -2.18 | -11.45 | -92.84 | -23.57 | -23.57 | -23.57 | -23.57 | -23.57 |
| Tax Rate, % | 84.16 | 84.16 | 84.16 | 84.16 | 84.16 | 84.16 | 84.16 | 84.16 | 84.16 | 84.16 |
| EBITAT | 519.1 | 392.2 | 491.8 | 77.6 | 130.4 | 110.3 | 86.1 | 67.2 | 52.5 | 41.0 |
| Depreciation | ||||||||||
| Changes in Account Receivables | ||||||||||
| Changes in Inventories | ||||||||||
| Changes in Accounts Payable | ||||||||||
| Capital Expenditure | ||||||||||
| UFCF | 188.6 | -758.9 | 214.1 | -1,053.7 | -673.0 | -1,748.8 | -381.4 | -297.8 | -232.5 | -181.5 |
| WACC, % | 3.52 | 3.14 | 4.28 | 1.96 | 2.01 | 2.98 | 2.98 | 2.98 | 2.98 | 2.98 |
| PV UFCF | ||||||||||
| SUM PV UFCF | -2,693.9 | |||||||||
| Long Term Growth Rate, % | 2.00 | |||||||||
| Free cash flow (T + 1) | -185 | |||||||||
| Terminal Value | -18,831 | |||||||||
| Present Terminal Value | -16,257 | |||||||||
| Enterprise Value | -18,951 | |||||||||
| Net Debt | 8,977 | |||||||||
| Equity Value | -27,928 | |||||||||
| Diluted Shares Outstanding, MM | 1,465 | |||||||||
| Equity Value Per Share | -19.07 |
What You Will Receive
- Genuine 600310SS Financial Data: Access to historical and projected figures for precise valuation.
- Customizable Parameters: Adjust WACC, tax rates, revenue growth, and capital expenditure variables.
- Real-Time Calculations: Automatically calculates intrinsic value and NPV as changes are made.
- Scenario Evaluation: Explore various scenarios to assess Guangxi Guidong Electric Power's future outlook.
- User-Friendly Interface: Designed for industry professionals, yet easy for newcomers to navigate.
Key Features
- Comprehensive Historical Data: Includes pre-filled financial information and future projections for Guangxi Guidong Electric Power Co., Ltd. (600310SS).
- Customizable Input Fields: Tailor assumptions for revenue growth, profit margins, discount rates, tax rates, and capital expenditures.
- Interactive Valuation Model: Automatically refreshes Net Present Value (NPV) and intrinsic value in response to your adjustments.
- Scenario Analysis: Generate various forecasting scenarios to evaluate different potential valuation results.
- Intuitive User Interface: Designed for ease of use, making it accessible for both industry experts and newcomers.
Process Overview
- Download: Obtain the pre-prepared Excel file featuring Guangxi Guidong Electric Power Co., Ltd.'s financial data.
- Customize: Modify projections for elements like revenue growth, EBITDA %, and WACC.
- Update Automatically: Watch as the intrinsic value and NPV calculations refresh in real-time.
- Test Scenarios: Develop various forecasts and instantly evaluate different outcomes.
- Make Decisions: Leverage the valuation insights to inform your investment strategies.
Why Opt for Guangxi Guidong Electric Power Co., Ltd. (600310SS) Calculator?
- Precision: Utilizes authentic Guangxi Guidong financial data for reliable results.
- Adaptability: Built for users to freely experiment with and adjust inputs.
- Efficiency: Eliminate the need to create a DCF model from the ground up.
- High-Quality: Crafted with the expertise and usability expected at the CFO level.
- Intuitive: Simple to navigate, even for those lacking advanced financial modeling skills.
Who Can Benefit from This Product?
- Energy Sector Students: Discover energy valuation methods and practice them with authentic data.
- Researchers: Integrate industry-standard models into your academic studies or projects.
- Investors: Validate your investment strategies and evaluate valuation results for Guangxi Guidong Electric Power Co., Ltd. (600310SS).
- Financial Analysts: Enhance your efficiency with a pre-designed, adaptable DCF model tailored for the energy market.
- Entrepreneurs: Learn how major public utilities like Guangxi Guidong Electric Power Co., Ltd. (600310SS) are assessed by analysts.
Contents of the Template
- Pre-Filled DCF Model: Guangxi Guidong Electric Power's financial data preloaded for immediate application.
- WACC Calculator: Comprehensive calculations for the Weighted Average Cost of Capital.
- Financial Ratios: Analyze Guangxi Guidong Electric Power's profitability, leverage, and operational efficiency.
- Editable Inputs: Adjust assumptions such as growth rates, profit margins, and capital expenditures to suit your scenarios.
- Financial Statements: Access annual and quarterly reports for in-depth analysis.
- Interactive Dashboard: Visualize key valuation metrics and results effortlessly.
Disclaimer
All information, articles, and product details provided on this website are for general informational and educational purposes only. We do not claim any ownership over, nor do we intend to infringe upon, any trademarks, copyrights, logos, brand names, or other intellectual property mentioned or depicted on this site. Such intellectual property remains the property of its respective owners, and any references here are made solely for identification or informational purposes, without implying any affiliation, endorsement, or partnership.
We make no representations or warranties, express or implied, regarding the accuracy, completeness, or suitability of any content or products presented. Nothing on this website should be construed as legal, tax, investment, financial, medical, or other professional advice. In addition, no part of this site—including articles or product references—constitutes a solicitation, recommendation, endorsement, advertisement, or offer to buy or sell any securities, franchises, or other financial instruments, particularly in jurisdictions where such activity would be unlawful.
All content is of a general nature and may not address the specific circumstances of any individual or entity. It is not a substitute for professional advice or services. Any actions you take based on the information provided here are strictly at your own risk. You accept full responsibility for any decisions or outcomes arising from your use of this website and agree to release us from any liability in connection with your use of, or reliance upon, the content or products found herein.