
|
TDG Holding Co., Ltd. (600330.SS) Évaluation DCF |
Entièrement Modifiable: Adapté À Vos Besoins Dans Excel Ou Sheets
Conception Professionnelle: Modèles Fiables Et Conformes Aux Normes Du Secteur
Pré-Construits Pour Une Utilisation Rapide Et Efficace
Compatible MAC/PC, entièrement débloqué
Aucune Expertise N'Est Requise; Facile À Suivre
TDG Holding Co., Ltd. (600330.SS) Bundle
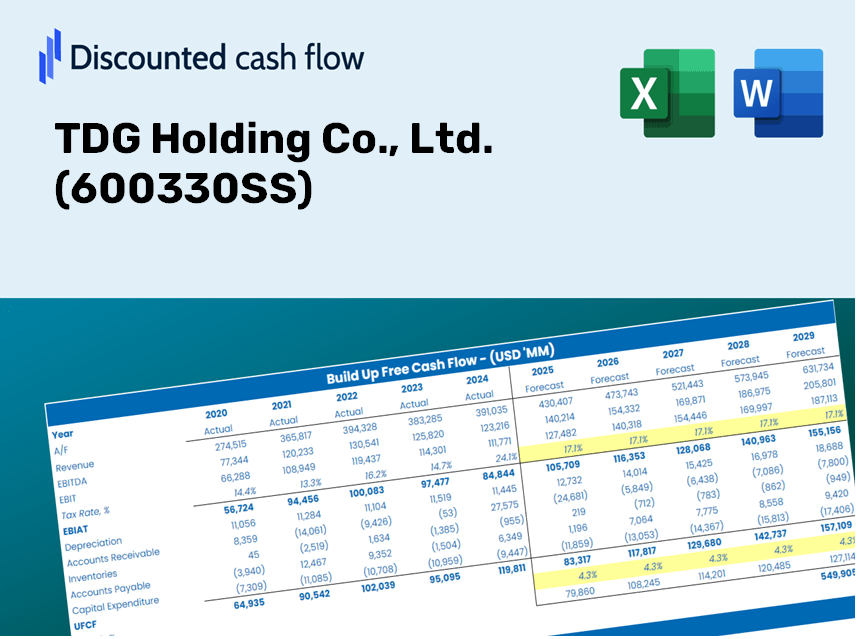
Explorez TDG Holding Co., Ltd. (600330SS) Perspectives financières avec notre calculatrice DCF facile à utiliser! Entrez vos projections pour la croissance, les marges bénéficiaires et les dépenses pour calculer la valeur intrinsèque de TDG Holding Co., Ltd. (600330SS) et améliorez votre stratégie d'investissement.
Discounted Cash Flow (DCF) - (USD MM)
| Year | AY1 2020 |
AY2 2021 |
AY3 2022 |
AY4 2023 |
AY5 2024 |
FY1 2025 |
FY2 2026 |
FY3 2027 |
FY4 2028 |
FY5 2029 |
|---|---|---|---|---|---|---|---|---|---|---|
| Revenue | 3,155.8 | 4,084.9 | 4,507.7 | 3,682.1 | 3,071.1 | 3,108.6 | 3,146.5 | 3,184.9 | 3,223.8 | 3,263.2 |
| Revenue Growth, % | 0 | 29.44 | 10.35 | -18.32 | -16.59 | 1.22 | 1.22 | 1.22 | 1.22 | 1.22 |
| EBITDA | 477.7 | 649.3 | 726.6 | 531.4 | 316.9 | 447.0 | 452.5 | 458.0 | 463.6 | 469.3 |
| EBITDA, % | 15.14 | 15.89 | 16.12 | 14.43 | 10.32 | 14.38 | 14.38 | 14.38 | 14.38 | 14.38 |
| Depreciation | 280.3 | 296.4 | 326.4 | 341.6 | 355.4 | 275.0 | 278.3 | 281.7 | 285.2 | 288.7 |
| Depreciation, % | 8.88 | 7.26 | 7.24 | 9.28 | 11.57 | 8.85 | 8.85 | 8.85 | 8.85 | 8.85 |
| EBIT | 197.3 | 352.9 | 400.2 | 189.9 | -38.5 | 172.0 | 174.1 | 176.3 | 178.4 | 180.6 |
| EBIT, % | 6.25 | 8.64 | 8.88 | 5.16 | -1.25 | 5.53 | 5.53 | 5.53 | 5.53 | 5.53 |
| Total Cash | 411.3 | 573.4 | 2,910.8 | 3,059.6 | 2,316.4 | 1,555.3 | 1,574.3 | 1,593.5 | 1,613.0 | 1,632.6 |
| Total Cash, percent | .0 | .0 | .0 | .0 | .0 | .0 | .0 | .0 | .0 | .0 |
| Account Receivables | 1,846.5 | 2,218.4 | 2,301.3 | 2,396.3 | 2,220.2 | 1,872.9 | 1,895.8 | 1,918.9 | 1,942.3 | 1,966.0 |
| Account Receivables, % | 58.51 | 54.31 | 51.05 | 65.08 | 72.29 | 60.25 | 60.25 | 60.25 | 60.25 | 60.25 |
| Inventories | 1,071.4 | 1,159.9 | 1,229.2 | 1,268.4 | 1,249.6 | 1,024.3 | 1,036.8 | 1,049.4 | 1,062.2 | 1,075.2 |
| Inventories, % | 33.95 | 28.39 | 27.27 | 34.45 | 40.69 | 32.95 | 32.95 | 32.95 | 32.95 | 32.95 |
| Accounts Payable | 982.5 | 1,489.4 | 1,992.9 | 2,183.6 | 2,186.2 | 1,506.4 | 1,524.8 | 1,543.4 | 1,562.2 | 1,581.3 |
| Accounts Payable, % | 31.13 | 36.46 | 44.21 | 59.3 | 71.19 | 48.46 | 48.46 | 48.46 | 48.46 | 48.46 |
| Capital Expenditure | -280.4 | -503.9 | -611.8 | -519.8 | -1,060.1 | -518.7 | -525.0 | -531.4 | -537.9 | -544.5 |
| Capital Expenditure, % | -8.88 | -12.34 | -13.57 | -14.12 | -34.52 | -16.69 | -16.69 | -16.69 | -16.69 | -16.69 |
| Tax Rate, % | -31.04 | -31.04 | -31.04 | -31.04 | -31.04 | -31.04 | -31.04 | -31.04 | -31.04 | -31.04 |
| EBITAT | 175.1 | 328.5 | 366.1 | 172.7 | -50.4 | 159.8 | 161.7 | 163.7 | 165.7 | 167.7 |
| Depreciation | ||||||||||
| Changes in Account Receivables | ||||||||||
| Changes in Inventories | ||||||||||
| Changes in Accounts Payable | ||||||||||
| Capital Expenditure | ||||||||||
| UFCF | -1,760.3 | 167.7 | 432.0 | 50.9 | -557.6 | -191.2 | -102.0 | -103.2 | -104.5 | -105.7 |
| WACC, % | 6.36 | 6.37 | 6.36 | 6.36 | 6.39 | 6.37 | 6.37 | 6.37 | 6.37 | 6.37 |
| PV UFCF | ||||||||||
| SUM PV UFCF | -514.9 | |||||||||
| Long Term Growth Rate, % | 2.00 | |||||||||
| Free cash flow (T + 1) | -108 | |||||||||
| Terminal Value | -2,469 | |||||||||
| Present Terminal Value | -1,813 | |||||||||
| Enterprise Value | -2,328 | |||||||||
| Net Debt | -1,372 | |||||||||
| Equity Value | -956 | |||||||||
| Diluted Shares Outstanding, MM | 1,217 | |||||||||
| Equity Value Per Share | -0.79 |
What You Will Receive
- Adjustable Forecast Inputs: Effortlessly modify key assumptions (growth %, margins, WACC) to generate various scenarios.
- Relevant Data: TDG Holding Co., Ltd. (600330SS) financial data pre-loaded to facilitate your analysis.
- Automatic DCF Results: The template computes Net Present Value (NPV) and intrinsic value automatically.
- Tailorable and Professional: A refined Excel model that customizes to fit your valuation requirements.
- Designed for Analysts and Investors: Perfect for evaluating projections, confirming strategies, and enhancing efficiency.
Key Features
- Comprehensive Data: TDG Holding Co., Ltd.'s historical financial records along with pre-filled projections.
- Customizable Inputs: Adjust WACC, tax rates, revenue growth, and EBITDA margins as needed.
- Real-Time Results: Observe the recalculation of TDG Holding Co., Ltd.'s intrinsic value instantly.
- Intuitive Visual Outputs: Dashboard graphs showcase valuation results and essential metrics.
- Designed for Precision: A professional-grade tool tailored for analysts, investors, and finance professionals.
How It Functions
- 1. Access the Template: Download and open the Excel file featuring TDG Holding Co., Ltd. (600330SS)’s preloaded data.
- 2. Modify Assumptions: Adjust crucial inputs such as growth rates, WACC, and capital expenditures.
- 3. View Results Immediately: The DCF model automatically calculates intrinsic value and NPV.
- 4. Explore Scenarios: Analyze various forecasts to assess different valuation outcomes.
- 5. Present with Assurance: Share professional valuation insights to back your decision-making.
Why Opt for TDG Holding Co., Ltd. (600330SS)?
- Precision: Rely on accurate financial data from TDG for informed decisions.
- Versatility: Tailored for users to easily adjust and explore various scenarios.
- Efficiency: Eliminate the need to create complex financial models from the ground up.
- Expert-Level Quality: Crafted with the insight and rigor akin to CFO standards.
- Intuitive Interface: Designed for ease of use, catering to both novices and seasoned professionals.
Who Should Consider TDG Holding Co., Ltd.?
- Institutional Investors: Develop comprehensive valuation models for in-depth portfolio assessment of TDG Holding Co. (600330SS).
- Corporate Finance Teams: Evaluate valuation scenarios to inform strategic decisions within their organizations.
- Financial Consultants and Advisors: Deliver precise valuation insights for clients interested in TDG Holding Co. (600330SS).
- Academics and Students: Utilize real-world data for hands-on practice in financial modeling and analysis.
- Market Enthusiasts: Gain insights into the valuation methodologies applied to companies like TDG Holding Co. (600330SS).
Contents of the Template
- Comprehensive DCF Model: An editable framework featuring detailed valuation calculations.
- Real-World Data: Historical and projected financial information for TDG Holding Co., Ltd. (600330SS) preloaded for thorough analysis.
- Customizable Parameters: Modify WACC, growth rates, and tax assumptions to explore various scenarios.
- Financial Statements: Complete annual and quarterly financial breakdowns for enhanced insights.
- Key Ratios: Integrated analysis for assessing profitability, efficiency, and leverage.
- Dashboard with Visual Outputs: Engaging charts and tables that provide clear and actionable insights.
Disclaimer
All information, articles, and product details provided on this website are for general informational and educational purposes only. We do not claim any ownership over, nor do we intend to infringe upon, any trademarks, copyrights, logos, brand names, or other intellectual property mentioned or depicted on this site. Such intellectual property remains the property of its respective owners, and any references here are made solely for identification or informational purposes, without implying any affiliation, endorsement, or partnership.
We make no representations or warranties, express or implied, regarding the accuracy, completeness, or suitability of any content or products presented. Nothing on this website should be construed as legal, tax, investment, financial, medical, or other professional advice. In addition, no part of this site—including articles or product references—constitutes a solicitation, recommendation, endorsement, advertisement, or offer to buy or sell any securities, franchises, or other financial instruments, particularly in jurisdictions where such activity would be unlawful.
All content is of a general nature and may not address the specific circumstances of any individual or entity. It is not a substitute for professional advice or services. Any actions you take based on the information provided here are strictly at your own risk. You accept full responsibility for any decisions or outcomes arising from your use of this website and agree to release us from any liability in connection with your use of, or reliance upon, the content or products found herein.