
|
Tibet Summit Resources Co., Ltd. (600338.SS) Évaluation DCF |
Entièrement Modifiable: Adapté À Vos Besoins Dans Excel Ou Sheets
Conception Professionnelle: Modèles Fiables Et Conformes Aux Normes Du Secteur
Pré-Construits Pour Une Utilisation Rapide Et Efficace
Compatible MAC/PC, entièrement débloqué
Aucune Expertise N'Est Requise; Facile À Suivre
Tibet Summit Resources Co.,Ltd. (600338.SS) Bundle
Révèlent le véritable potentiel de Tibet Summit Resources Co., Ltd. (600338SS) avec notre calculatrice avancée DCF! Ajustez les hypothèses clés, explorez divers scénarios et évaluez comment les modifications affectent l'évaluation du Tibet Summit Resources Co., Ltd. (600338SS) - le tout dans un modèle Excel pratique.
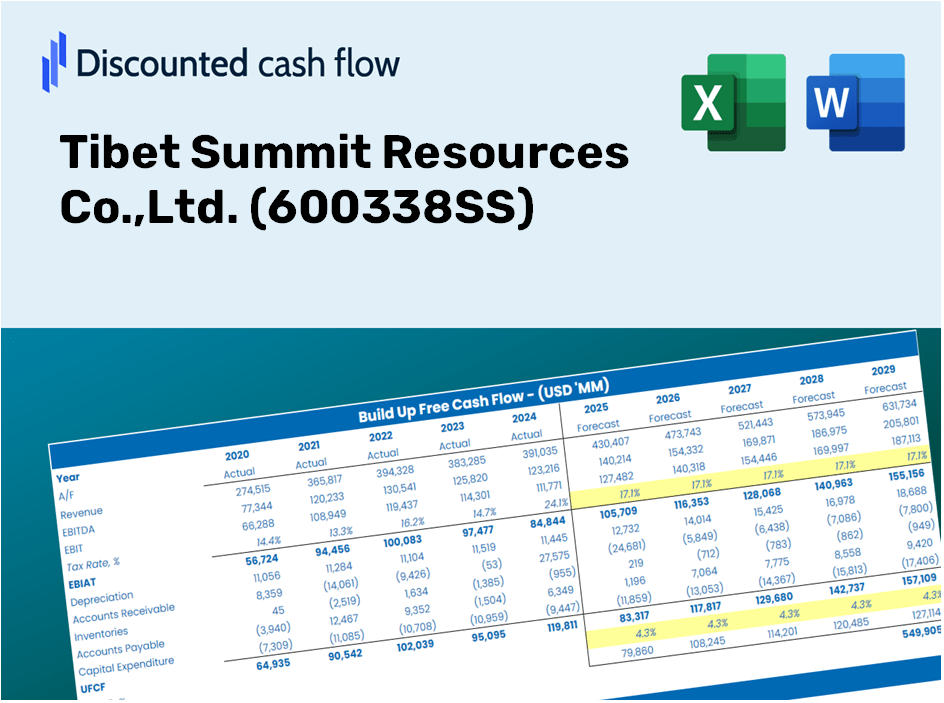
Discounted Cash Flow (DCF) - (USD MM)
| Year | AY1 2020 |
AY2 2021 |
AY3 2022 |
AY4 2023 |
AY5 2024 |
FY1 2025 |
FY2 2026 |
FY3 2027 |
FY4 2028 |
FY5 2029 |
|---|---|---|---|---|---|---|---|---|---|---|
| Revenue | 1,132.6 | 2,048.6 | 1,972.6 | 1,468.5 | 1,639.5 | 1,898.7 | 2,199.0 | 2,546.7 | 2,949.4 | 3,415.8 |
| Revenue Growth, % | 0 | 80.88 | -3.71 | -25.56 | 11.64 | 15.81 | 15.81 | 15.81 | 15.81 | 15.81 |
| EBITDA | 286.7 | 1,083.5 | 1,164.3 | 261.4 | 747.2 | 761.8 | 882.3 | 1,021.8 | 1,183.3 | 1,370.5 |
| EBITDA, % | 25.32 | 52.89 | 59.02 | 17.8 | 45.58 | 40.12 | 40.12 | 40.12 | 40.12 | 40.12 |
| Depreciation | 113.4 | 171.8 | 505.1 | 358.1 | 345.5 | 339.7 | 393.4 | 455.7 | 527.7 | 611.2 |
| Depreciation, % | 10.01 | 8.39 | 25.61 | 24.38 | 21.08 | 17.89 | 17.89 | 17.89 | 17.89 | 17.89 |
| EBIT | 173.4 | 911.6 | 659.1 | -96.6 | 401.7 | 422.1 | 488.8 | 566.1 | 655.6 | 759.3 |
| EBIT, % | 15.31 | 44.5 | 33.41 | -6.58 | 24.5 | 22.23 | 22.23 | 22.23 | 22.23 | 22.23 |
| Total Cash | 293.9 | 105.6 | 58.7 | 21.6 | 153.6 | 170.6 | 197.5 | 228.8 | 265.0 | 306.9 |
| Total Cash, percent | .0 | .0 | .0 | .0 | .0 | .0 | .0 | .0 | .0 | .0 |
| Account Receivables | 97.8 | 82.5 | 117.4 | 56.9 | 9.4 | 87.6 | 101.4 | 117.5 | 136.0 | 157.5 |
| Account Receivables, % | 8.64 | 4.03 | 5.95 | 3.87 | 0.57103 | 4.61 | 4.61 | 4.61 | 4.61 | 4.61 |
| Inventories | 113.7 | 127.8 | 208.4 | 202.6 | 171.4 | 194.0 | 224.7 | 260.2 | 301.4 | 349.0 |
| Inventories, % | 10.04 | 6.24 | 10.56 | 13.79 | 10.46 | 10.22 | 10.22 | 10.22 | 10.22 | 10.22 |
| Accounts Payable | 366.0 | 245.8 | 447.7 | 660.7 | 779.0 | 605.7 | 701.5 | 812.5 | 940.9 | 1,089.7 |
| Accounts Payable, % | 32.31 | 12 | 22.69 | 44.99 | 47.52 | 31.9 | 31.9 | 31.9 | 31.9 | 31.9 |
| Capital Expenditure | -190.1 | -556.1 | -1,116.7 | -375.4 | -437.9 | -580.3 | -672.1 | -778.3 | -901.4 | -1,044.0 |
| Capital Expenditure, % | -16.79 | -27.14 | -56.61 | -25.57 | -26.71 | -30.56 | -30.56 | -30.56 | -30.56 | -30.56 |
| Tax Rate, % | 30.51 | 30.51 | 30.51 | 30.51 | 30.51 | 30.51 | 30.51 | 30.51 | 30.51 | 30.51 |
| EBITAT | 31.4 | 746.9 | 469.4 | -99.8 | 279.1 | 287.6 | 333.1 | 385.8 | 446.8 | 517.4 |
| Depreciation | ||||||||||
| Changes in Account Receivables | ||||||||||
| Changes in Inventories | ||||||||||
| Changes in Accounts Payable | ||||||||||
| Capital Expenditure | ||||||||||
| UFCF | 109.1 | 243.7 | -55.8 | 162.1 | 383.8 | -227.0 | 105.7 | 122.5 | 141.8 | 164.2 |
| WACC, % | 6.78 | 7.15 | 7.09 | 7.25 | 7.08 | 7.07 | 7.07 | 7.07 | 7.07 | 7.07 |
| PV UFCF | ||||||||||
| SUM PV UFCF | 204.6 | |||||||||
| Long Term Growth Rate, % | 4.00 | |||||||||
| Free cash flow (T + 1) | 171 | |||||||||
| Terminal Value | 5,567 | |||||||||
| Present Terminal Value | 3,957 | |||||||||
| Enterprise Value | 4,161 | |||||||||
| Net Debt | 92 | |||||||||
| Equity Value | 4,069 | |||||||||
| Diluted Shares Outstanding, MM | 914 | |||||||||
| Equity Value Per Share | 4.45 |
What You Will Receive
- Adjustable Forecast Parameters: Effortlessly modify assumptions (growth %, profit margins, WACC) to explore various scenarios.
- Comprehensive Financial Data: Tibet Summit Resources Co., Ltd.’s financial information pre-loaded to facilitate your analysis.
- Instant DCF Calculations: The template automatically computes Net Present Value (NPV) and intrinsic value for you.
- Tailored and Professional Layout: A refined Excel model that can be customized to meet your valuation requirements.
- Designed for Analysts and Investors: Perfect for evaluating projections, confirming strategies, and enhancing efficiency.
Key Features
- Comprehensive Historical Data: Access Tibet Summit Resources Co.,Ltd.’s (600338SS) past financial statements and anticipated forecasts.
- Customizable Parameters: Modify WACC, tax rates, revenue growth, and EBITDA margins according to your needs.
- Real-Time Insights: Watch the intrinsic value of Tibet Summit Resources Co.,Ltd. (600338SS) update instantaneously.
- Intuitive Visual Representation: Utilize dashboard charts to visualize valuation outcomes and essential metrics.
- Engineered for Precision: A professional-grade tool tailored for analysts, investors, and finance professionals.
How It Works
- Step 1: Download the Excel file for Tibet Summit Resources Co., Ltd. (600338SS).
- Step 2: Review the pre-filled financial data and forecasts specific to Tibet Summit Resources.
- Step 3: Adjust key inputs such as revenue growth, WACC, and tax rates in the highlighted cells.
- Step 4: Observe the DCF model update in real-time as you modify your assumptions.
- Step 5: Analyze the outputs to inform your investment decisions regarding Tibet Summit Resources Co., Ltd. (600338SS).
Why Select Our Calculator for Tibet Summit Resources Co.,Ltd. (600338SS)?
- Designed for Industry Experts: A sophisticated tool utilized by analysts, CFOs, and consultants in the mining sector.
- Accurate Financial Data: Historical and projected financial information for Tibet Summit Resources preloaded for precision.
- Comprehensive Scenario Analysis: Easily test various forecasts and assumptions to inform your decisions.
- Clear and Informative Outputs: Automatically computes intrinsic value, NPV, and other essential metrics.
- User-Friendly Interface: Step-by-step guidance simplifies the calculation process.
Who Should Benefit from Tibet Summit Resources Co., Ltd. (600338SS)?
- Finance Students: Discover resource valuation methods and practice with real-time data.
- Researchers: Utilize industry models to enhance academic projects or studies.
- Investors: Evaluate your investment strategies and analyze the valuation trends of Tibet Summit Resources Co., Ltd. (600338SS).
- Market Analysts: Optimize your analysis process with a ready-to-use, customizable financial model.
- Entrepreneurs: Understand how major resource companies like Tibet Summit Resources Co., Ltd. (600338SS) are assessed in the market.
Contents of the Template
- Historical Data: Provides Tibet Summit Resources Co., Ltd.'s (600338SS) previous financial results and foundational forecasts.
- DCF and Levered DCF Models: Comprehensive templates designed to derive the intrinsic value of Tibet Summit Resources Co., Ltd. (600338SS).
- WACC Sheet: Pre-configured calculations for the Weighted Average Cost of Capital.
- Editable Inputs: Adjust essential drivers such as growth rates, EBITDA percentages, and CAPEX assumptions.
- Quarterly and Annual Statements: An in-depth analysis of Tibet Summit Resources Co., Ltd.'s (600338SS) financial performance.
- Interactive Dashboard: Dynamic visualization of valuation outcomes and forecasts.
Disclaimer
All information, articles, and product details provided on this website are for general informational and educational purposes only. We do not claim any ownership over, nor do we intend to infringe upon, any trademarks, copyrights, logos, brand names, or other intellectual property mentioned or depicted on this site. Such intellectual property remains the property of its respective owners, and any references here are made solely for identification or informational purposes, without implying any affiliation, endorsement, or partnership.
We make no representations or warranties, express or implied, regarding the accuracy, completeness, or suitability of any content or products presented. Nothing on this website should be construed as legal, tax, investment, financial, medical, or other professional advice. In addition, no part of this site—including articles or product references—constitutes a solicitation, recommendation, endorsement, advertisement, or offer to buy or sell any securities, franchises, or other financial instruments, particularly in jurisdictions where such activity would be unlawful.
All content is of a general nature and may not address the specific circumstances of any individual or entity. It is not a substitute for professional advice or services. Any actions you take based on the information provided here are strictly at your own risk. You accept full responsibility for any decisions or outcomes arising from your use of this website and agree to release us from any liability in connection with your use of, or reliance upon, the content or products found herein.