
|
Shan Xi Huayang Group New Energy Co., Ltd. (600348.SS) Évaluation DCF |
Entièrement Modifiable: Adapté À Vos Besoins Dans Excel Ou Sheets
Conception Professionnelle: Modèles Fiables Et Conformes Aux Normes Du Secteur
Pré-Construits Pour Une Utilisation Rapide Et Efficace
Compatible MAC/PC, entièrement débloqué
Aucune Expertise N'Est Requise; Facile À Suivre
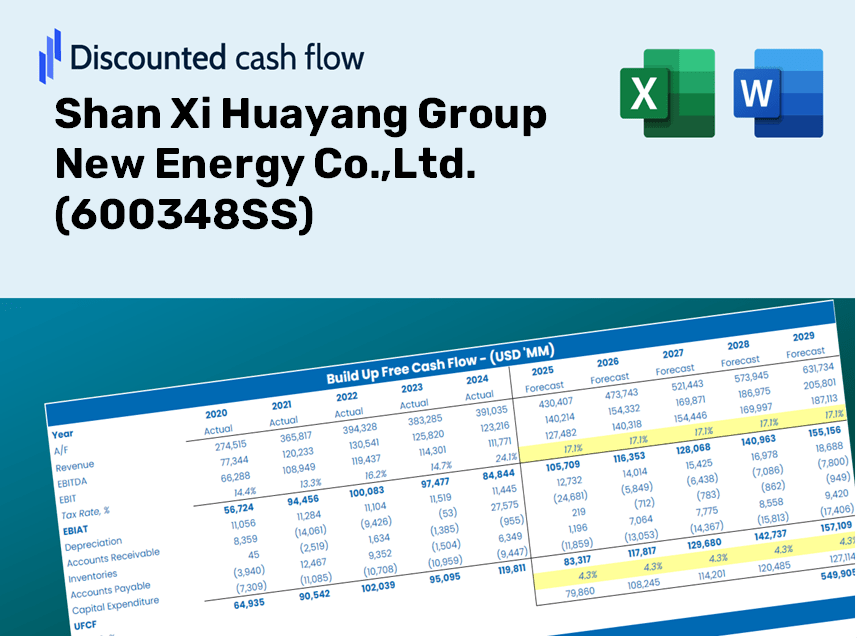
Shan Xi Huayang Group New Energy Co.,Ltd. (600348.SS) Bundle
Simplifier Shan Xi Huayang Group New Energy Co., Ltd. (600348SS) Évaluation avec cette calculatrice DCF personnalisable! Avec Real Shan Xi Huayang Group New Energy Co., Ltd. (600348SS) Financials and Adjustable Prévisions Antaires, vous pouvez tester les scénarios et découvrir Shan Xi Huayang Group New Energy Co., Ltd. (600348SS) Juste valeur en minutes.
Discounted Cash Flow (DCF) - (USD MM)
| Year | AY1 2020 |
AY2 2021 |
AY3 2022 |
AY4 2023 |
AY5 2024 |
FY1 2025 |
FY2 2026 |
FY3 2027 |
FY4 2028 |
FY5 2029 |
|---|---|---|---|---|---|---|---|---|---|---|
| Revenue | 31,181.5 | 38,032.6 | 35,045.9 | 28,518.2 | 25,060.2 | 24,018.1 | 23,019.4 | 22,062.2 | 21,144.8 | 20,265.5 |
| Revenue Growth, % | 0 | 21.97 | -7.85 | -18.63 | -12.13 | -4.16 | -4.16 | -4.16 | -4.16 | -4.16 |
| EBITDA | 4,367.2 | 11,549.3 | 14,152.3 | 10,537.5 | 6,138.4 | 7,022.9 | 6,730.8 | 6,451.0 | 6,182.7 | 5,925.6 |
| EBITDA, % | 14.01 | 30.37 | 40.38 | 36.95 | 24.49 | 29.24 | 29.24 | 29.24 | 29.24 | 29.24 |
| Depreciation | 2,218.1 | 2,262.8 | 2,373.6 | 2,471.8 | 2,268.9 | 1,804.1 | 1,729.1 | 1,657.2 | 1,588.3 | 1,522.2 |
| Depreciation, % | 7.11 | 5.95 | 6.77 | 8.67 | 9.05 | 7.51 | 7.51 | 7.51 | 7.51 | 7.51 |
| EBIT | 2,149.1 | 9,286.5 | 11,778.7 | 8,065.6 | 3,869.6 | 5,218.8 | 5,001.7 | 4,793.8 | 4,594.4 | 4,403.4 |
| EBIT, % | 6.89 | 24.42 | 33.61 | 28.28 | 15.44 | 21.73 | 21.73 | 21.73 | 21.73 | 21.73 |
| Total Cash | 8,534.6 | 16,068.0 | 17,434.7 | 14,497.4 | 11,619.8 | 10,403.2 | 9,970.6 | 9,556.0 | 9,158.7 | 8,777.8 |
| Total Cash, percent | .0 | .0 | .0 | .0 | .0 | .0 | .0 | .0 | .0 | .0 |
| Account Receivables | 5,652.8 | 5,509.8 | 2,710.8 | 2,362.1 | 2,337.0 | 2,784.1 | 2,668.4 | 2,557.4 | 2,451.1 | 2,349.1 |
| Account Receivables, % | 18.13 | 14.49 | 7.73 | 8.28 | 9.33 | 11.59 | 11.59 | 11.59 | 11.59 | 11.59 |
| Inventories | 680.6 | 643.1 | 698.1 | 677.0 | 801.7 | 549.5 | 526.6 | 504.7 | 483.7 | 463.6 |
| Inventories, % | 2.18 | 1.69 | 1.99 | 2.37 | 3.2 | 2.29 | 2.29 | 2.29 | 2.29 | 2.29 |
| Accounts Payable | 11,023.0 | 11,863.3 | 11,029.2 | 11,373.9 | 12,499.8 | 9,020.1 | 8,645.0 | 8,285.5 | 7,941.0 | 7,610.8 |
| Accounts Payable, % | 35.35 | 31.19 | 31.47 | 39.88 | 49.88 | 37.56 | 37.56 | 37.56 | 37.56 | 37.56 |
| Capital Expenditure | -2,148.5 | -1,671.1 | -4,553.5 | -6,590.6 | -13,369.5 | -4,839.0 | -4,637.8 | -4,444.9 | -4,260.1 | -4,083.0 |
| Capital Expenditure, % | -6.89 | -4.39 | -12.99 | -23.11 | -53.35 | -20.15 | -20.15 | -20.15 | -20.15 | -20.15 |
| Tax Rate, % | 38.45 | 38.45 | 38.45 | 38.45 | 38.45 | 38.45 | 38.45 | 38.45 | 38.45 | 38.45 |
| EBITAT | 1,664.6 | 5,331.8 | 7,638.4 | 5,295.9 | 2,381.6 | 3,412.3 | 3,270.4 | 3,134.4 | 3,004.1 | 2,879.2 |
| Depreciation | ||||||||||
| Changes in Account Receivables | ||||||||||
| Changes in Inventories | ||||||||||
| Changes in Accounts Payable | ||||||||||
| Capital Expenditure | ||||||||||
| UFCF | 6,423.8 | 6,944.3 | 7,368.4 | 1,891.6 | -7,692.7 | -3,297.3 | 125.2 | 120.0 | 115.0 | 110.3 |
| WACC, % | 4.12 | 3.81 | 3.92 | 3.94 | 3.87 | 3.93 | 3.93 | 3.93 | 3.93 | 3.93 |
| PV UFCF | ||||||||||
| SUM PV UFCF | -2,760.1 | |||||||||
| Long Term Growth Rate, % | 0.50 | |||||||||
| Free cash flow (T + 1) | 111 | |||||||||
| Terminal Value | 3,228 | |||||||||
| Present Terminal Value | 2,662 | |||||||||
| Enterprise Value | -98 | |||||||||
| Net Debt | 10,170 | |||||||||
| Equity Value | -10,268 | |||||||||
| Diluted Shares Outstanding, MM | 3,771 | |||||||||
| Equity Value Per Share | -2.72 |
Benefits You Will Receive
- Pre-Loaded Financial Model: Leveraging Shan Xi Huayang Group's actual data for accurate DCF valuation.
- Comprehensive Forecasting Control: Modify revenue growth, profit margins, WACC, and other essential metrics.
- Real-Time Calculations: Automatic updates allow you to view results immediately as adjustments are made.
- Professional-Grade Template: A polished Excel file crafted for high-quality valuation analysis.
- Fully Customizable and Reusable: Designed for adaptability, facilitating repeated use for in-depth forecasts.
Key Features
- Customizable Forecast Inputs: Adjust essential factors such as revenue growth, EBITDA margin, and capital investments.
- Instant DCF Valuation: Automatically computes intrinsic value, NPV, and additional financial metrics.
- High-Precision Results: Leverages Shan Xi Huayang Group’s (600348SS) actual financial data for accurate valuation insights.
- Effortless Scenario Analysis: Easily assess various assumptions and analyze their effects on outcomes.
- Efficiency Enhancer: Remove the complexity of crafting detailed valuation models from the ground up.
How It Operates
- Download the Template: Gain immediate access to the Excel-based Shan Xi Huayang Group New Energy Co., Ltd. (600348SS) DCF Calculator.
- Input Your Assumptions: Modify the yellow-highlighted cells for growth rates, WACC, profit margins, and additional variables.
- Instant Calculations: The model will promptly update the intrinsic value of Shan Xi Huayang Group New Energy Co., Ltd. (600348SS).
- Test Scenarios: Experiment with various assumptions to assess potential changes in valuation.
- Analyze and Decide: Utilize the outcomes to inform your investment strategies or financial evaluations.
Why Opt for This Calculator for Shan Xi Huayang Group New Energy Co., Ltd. (600348SS)?
- Reliable Data: Utilize accurate financials from Shan Xi Huayang to achieve trustworthy valuation outcomes.
- Tailored Options: Modify essential parameters such as growth projections, WACC, and tax rates to align with your forecasts.
- Efficient: Built-in calculations streamline the process, saving you time and effort.
- Professional-Quality Tool: Crafted for investors, analysts, and consultants in the energy sector.
- Easy to Use: User-friendly design and clear, step-by-step guidance ensure accessibility for all skill levels.
Who Can Benefit from This Product?
- Investors: Evaluate Shan Xi Huayang Group New Energy Co., Ltd.'s [600348SS] valuation for informed buying or selling decisions.
- CFOs and Financial Analysts: Optimize valuation processes and validate forecasts for [600348SS].
- Startup Founders: Gain insights into how prominent companies like Shan Xi Huayang Group [600348SS] establish their market value.
- Consultants: Create comprehensive valuation reports tailored for clients based on [600348SS].
- Students and Educators: Utilize current data to learn and teach valuation methods with a focus on [600348SS].
Contents of the Template
- Operating and Balance Sheet Data: Pre-filled historical data and forecasts for Shan Xi Huayang Group New Energy Co., Ltd. (600348SS), including revenue, EBITDA, EBIT, and capital expenditures.
- WACC Calculation: A dedicated sheet for Weighted Average Cost of Capital (WACC), featuring parameters such as Beta, risk-free rate, and share price.
- DCF Valuation (Unlevered and Levered): Customizable Discounted Cash Flow models that display intrinsic value with comprehensive calculations.
- Financial Statements: Pre-loaded annual and quarterly financial statements to facilitate analysis.
- Key Ratios: Includes profitability, leverage, and efficiency ratios relevant to Shan Xi Huayang Group New Energy Co., Ltd. (600348SS).
- Dashboard and Charts: Visual summaries of valuation outputs and assumptions for easier analysis of results.
Disclaimer
All information, articles, and product details provided on this website are for general informational and educational purposes only. We do not claim any ownership over, nor do we intend to infringe upon, any trademarks, copyrights, logos, brand names, or other intellectual property mentioned or depicted on this site. Such intellectual property remains the property of its respective owners, and any references here are made solely for identification or informational purposes, without implying any affiliation, endorsement, or partnership.
We make no representations or warranties, express or implied, regarding the accuracy, completeness, or suitability of any content or products presented. Nothing on this website should be construed as legal, tax, investment, financial, medical, or other professional advice. In addition, no part of this site—including articles or product references—constitutes a solicitation, recommendation, endorsement, advertisement, or offer to buy or sell any securities, franchises, or other financial instruments, particularly in jurisdictions where such activity would be unlawful.
All content is of a general nature and may not address the specific circumstances of any individual or entity. It is not a substitute for professional advice or services. Any actions you take based on the information provided here are strictly at your own risk. You accept full responsibility for any decisions or outcomes arising from your use of this website and agree to release us from any liability in connection with your use of, or reliance upon, the content or products found herein.