
|
Ningbo Yunsheng Co., Ltd. (600366.SS) Évaluation DCF |
Entièrement Modifiable: Adapté À Vos Besoins Dans Excel Ou Sheets
Conception Professionnelle: Modèles Fiables Et Conformes Aux Normes Du Secteur
Pré-Construits Pour Une Utilisation Rapide Et Efficace
Compatible MAC/PC, entièrement débloqué
Aucune Expertise N'Est Requise; Facile À Suivre
Ningbo Yunsheng Co., Ltd. (600366.SS) Bundle
Conçu pour la précision, notre (600366SS) La calculatrice DCF vous permet d'évaluer la valorisation Ningbo Yunsheng Co., Ltd. à l'aide de données financières à jour et la flexibilité pour modifier tous les paramètres clés pour des projestes améliorées.
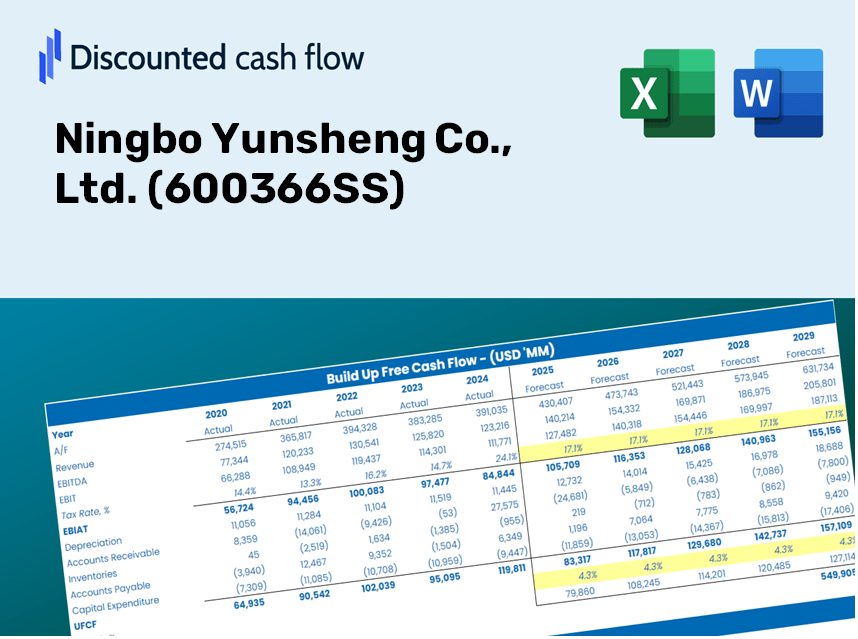
Discounted Cash Flow (DCF) - (USD MM)
| Year | AY1 2020 |
AY2 2021 |
AY3 2022 |
AY4 2023 |
AY5 2024 |
FY1 2025 |
FY2 2026 |
FY3 2027 |
FY4 2028 |
FY5 2029 |
|---|---|---|---|---|---|---|---|---|---|---|
| Revenue | 2,399.1 | 3,754.0 | 6,409.4 | 5,369.4 | 5,041.5 | 6,363.3 | 8,031.7 | 10,137.5 | 12,795.4 | 16,150.3 |
| Revenue Growth, % | 0 | 56.47 | 70.74 | -16.23 | -6.11 | 26.22 | 26.22 | 26.22 | 26.22 | 26.22 |
| EBITDA | 152.8 | 500.1 | 489.5 | -167.0 | 148.9 | 345.8 | 436.5 | 551.0 | 695.4 | 877.7 |
| EBITDA, % | 6.37 | 13.32 | 7.64 | -3.11 | 2.95 | 5.43 | 5.43 | 5.43 | 5.43 | 5.43 |
| Depreciation | 106.8 | 99.0 | 93.8 | 136.8 | 133.5 | 175.0 | 220.9 | 278.8 | 351.9 | 444.2 |
| Depreciation, % | 4.45 | 2.64 | 1.46 | 2.55 | 2.65 | 2.75 | 2.75 | 2.75 | 2.75 | 2.75 |
| EBIT | 46.0 | 401.1 | 395.7 | -303.8 | 15.4 | 170.8 | 215.6 | 272.1 | 343.5 | 433.5 |
| EBIT, % | 1.92 | 10.68 | 6.17 | -5.66 | 0.30461 | 2.68 | 2.68 | 2.68 | 2.68 | 2.68 |
| Total Cash | 1,776.5 | 1,403.2 | 1,595.9 | 1,665.9 | 1,455.0 | 2,497.1 | 3,151.8 | 3,978.2 | 5,021.3 | 6,337.8 |
| Total Cash, percent | .0 | .0 | .0 | .0 | .0 | .0 | .0 | .0 | .0 | .0 |
| Account Receivables | 731.2 | 1,189.4 | 2,269.5 | 2,223.0 | 2,328.2 | 2,356.3 | 2,974.2 | 3,753.9 | 4,738.2 | 5,980.5 |
| Account Receivables, % | 30.48 | 31.68 | 35.41 | 41.4 | 46.18 | 37.03 | 37.03 | 37.03 | 37.03 | 37.03 |
| Inventories | 1,012.5 | 2,248.8 | 2,875.3 | 1,676.3 | 1,401.0 | 2,621.4 | 3,308.7 | 4,176.2 | 5,271.2 | 6,653.2 |
| Inventories, % | 42.2 | 59.9 | 44.86 | 31.22 | 27.79 | 41.2 | 41.2 | 41.2 | 41.2 | 41.2 |
| Accounts Payable | 348.9 | 740.8 | 1,127.2 | 942.3 | 1,706.9 | 1,314.3 | 1,658.9 | 2,093.8 | 2,642.8 | 3,335.7 |
| Accounts Payable, % | 14.54 | 19.73 | 17.59 | 17.55 | 33.86 | 20.65 | 20.65 | 20.65 | 20.65 | 20.65 |
| Capital Expenditure | -209.1 | -209.5 | -151.3 | -117.1 | -51.8 | -252.8 | -319.1 | -402.7 | -508.3 | -641.6 |
| Capital Expenditure, % | -8.71 | -5.58 | -2.36 | -2.18 | -1.03 | -3.97 | -3.97 | -3.97 | -3.97 | -3.97 |
| Tax Rate, % | -25.29 | -25.29 | -25.29 | -25.29 | -25.29 | -25.29 | -25.29 | -25.29 | -25.29 | -25.29 |
| EBITAT | 38.2 | 364.3 | 376.8 | -229.1 | 19.2 | 151.9 | 191.7 | 241.9 | 305.4 | 385.4 |
| Depreciation | ||||||||||
| Changes in Account Receivables | ||||||||||
| Changes in Inventories | ||||||||||
| Changes in Accounts Payable | ||||||||||
| Capital Expenditure | ||||||||||
| UFCF | -1,458.8 | -1,048.7 | -1,000.9 | 851.3 | 1,035.7 | -1,567.1 | -867.0 | -1,094.3 | -1,381.3 | -1,743.4 |
| WACC, % | 11.61 | 11.62 | 11.63 | 11.59 | 11.64 | 11.62 | 11.62 | 11.62 | 11.62 | 11.62 |
| PV UFCF | ||||||||||
| SUM PV UFCF | -4,782.7 | |||||||||
| Long Term Growth Rate, % | 2.00 | |||||||||
| Free cash flow (T + 1) | -1,778 | |||||||||
| Terminal Value | -18,484 | |||||||||
| Present Terminal Value | -10,668 | |||||||||
| Enterprise Value | -15,450 | |||||||||
| Net Debt | -509 | |||||||||
| Equity Value | -14,941 | |||||||||
| Diluted Shares Outstanding, MM | 1,089 | |||||||||
| Equity Value Per Share | -13.72 |
What You Will Receive
- Authentic Ningbo Yunsheng (600366SS) Financials: Access to historical and projected data for precise valuation.
- Customizable Inputs: Adjust WACC, tax rates, revenue growth, and capital expenditures as needed.
- Automated Calculations: Intrinsic value and NPV are computed in real-time.
- Scenario Analysis: Explore various scenarios to assess Ningbo Yunsheng's future performance.
- User-Friendly Interface: Designed for professionals but easy to navigate for newcomers.
Key Features
- Comprehensive DCF Calculator: Features intricate unlevered and levered DCF valuation models tailored for Ningbo Yunsheng Co., Ltd. (600366SS).
- WACC Estimator: Pre-designed Weighted Average Cost of Capital sheet with adjustable parameters for precise calculations.
- Customizable Forecast Assumptions: Adjust growth projections, capital expenditures, and discount rates to fit your analysis.
- Integrated Financial Ratios: Evaluate profitability, leverage, and efficiency ratios specifically for Ningbo Yunsheng Co., Ltd. (600366SS).
- Visual Dashboard and Charts: Graphical representations condense essential valuation metrics for straightforward review.
How It Operates
- 1. Access the Template: Download and open the Excel file featuring preloaded data for Ningbo Yunsheng Co., Ltd. (600366SS).
- 2. Modify Assumptions: Adjust key parameters such as growth rates, WACC, and capital expenditures.
- 3. Instant Results: The DCF model automatically computes intrinsic value and NPV in real-time.
- 4. Evaluate Different Scenarios: Analyze various forecasts to understand different valuation possibilities.
- 5. Present with Confidence: Share professional valuation insights to inform your decision-making process.
Why Select Ningbo Yunsheng Co., Ltd. Calculator?
- All-in-One Tool: Features DCF, WACC, and financial ratio analyses seamlessly integrated.
- Flexible Inputs: Modify yellow-highlighted cells to explore different financial scenarios.
- In-Depth Analysis: Automatically computes Ningbo Yunsheng’s intrinsic value and Net Present Value.
- Preloaded Information: Utilizes historical and projected data for precise starting points.
- High-Quality Standards: Perfect for financial analysts, investors, and business advisors.
Who Should Benefit from Ningbo Yunsheng Co., Ltd. (600366SS)?
- Finance Students: Explore valuation methods and apply them using real market data.
- Academics: Integrate industry-standard models into your research or teaching materials.
- Investors: Evaluate your investment hypotheses and analyze the valuation results for Ningbo Yunsheng (600366SS).
- Analysts: Enhance your efficiency with a customizable DCF model designed for Ningbo Yunsheng (600366SS).
- Small Business Owners: Understand the methodologies used to analyze large corporations like Ningbo Yunsheng (600366SS).
Overview of the Template Components
- Operating and Balance Sheet Data: Pre-filled historical data and forecasts for Ningbo Yunsheng Co., Ltd. (600366SS), including revenue, EBITDA, EBIT, and capital expenditures.
- WACC Calculation: A dedicated sheet for calculating the Weighted Average Cost of Capital (WACC), featuring inputs such as Beta, risk-free rate, and share price.
- DCF Valuation (Unlevered and Levered): Customizable Discounted Cash Flow models that display intrinsic value along with comprehensive calculations.
- Financial Statements: Pre-loaded annual and quarterly financial statements to facilitate in-depth analysis.
- Key Ratios: A compilation of profitability, leverage, and efficiency ratios specific to Ningbo Yunsheng Co., Ltd. (600366SS).
- Dashboard and Charts: A visual overview of valuation results and underlying assumptions for straightforward analysis.
Disclaimer
All information, articles, and product details provided on this website are for general informational and educational purposes only. We do not claim any ownership over, nor do we intend to infringe upon, any trademarks, copyrights, logos, brand names, or other intellectual property mentioned or depicted on this site. Such intellectual property remains the property of its respective owners, and any references here are made solely for identification or informational purposes, without implying any affiliation, endorsement, or partnership.
We make no representations or warranties, express or implied, regarding the accuracy, completeness, or suitability of any content or products presented. Nothing on this website should be construed as legal, tax, investment, financial, medical, or other professional advice. In addition, no part of this site—including articles or product references—constitutes a solicitation, recommendation, endorsement, advertisement, or offer to buy or sell any securities, franchises, or other financial instruments, particularly in jurisdictions where such activity would be unlawful.
All content is of a general nature and may not address the specific circumstances of any individual or entity. It is not a substitute for professional advice or services. Any actions you take based on the information provided here are strictly at your own risk. You accept full responsibility for any decisions or outcomes arising from your use of this website and agree to release us from any liability in connection with your use of, or reliance upon, the content or products found herein.