
|
Southwest Securities Co., Ltd. (600369.SS) Évaluation DCF |
Entièrement Modifiable: Adapté À Vos Besoins Dans Excel Ou Sheets
Conception Professionnelle: Modèles Fiables Et Conformes Aux Normes Du Secteur
Pré-Construits Pour Une Utilisation Rapide Et Efficace
Compatible MAC/PC, entièrement débloqué
Aucune Expertise N'Est Requise; Facile À Suivre
Southwest Securities Co., Ltd. (600369.SS) Bundle
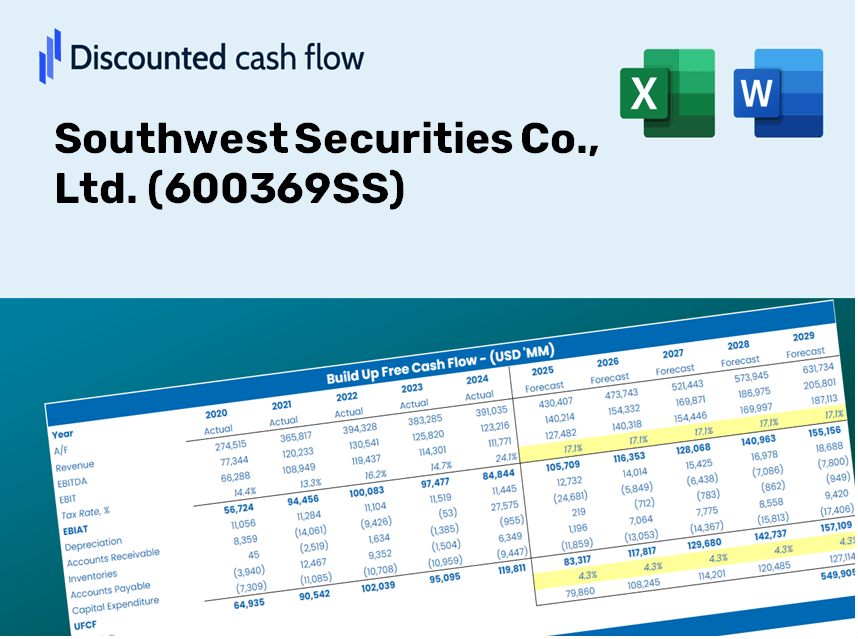
En tant qu'investisseur ou analyste, la calculatrice DCF [600369SS] est votre ressource incontournable pour une évaluation précise. Chargé de données réelles de Southwest Securities Co., Ltd., vous pouvez ajuster les prévisions et voir instantanément les résultats.
Discounted Cash Flow (DCF) - (USD MM)
| Year | AY1 2020 |
AY2 2021 |
AY3 2022 |
AY4 2023 |
AY5 2024 |
FY1 2025 |
FY2 2026 |
FY3 2027 |
FY4 2028 |
FY5 2029 |
|---|---|---|---|---|---|---|---|---|---|---|
| Revenue | 3,125.8 | 3,051.7 | 1,784.1 | 2,320.7 | 2,535.9 | 2,507.1 | 2,478.5 | 2,450.3 | 2,422.4 | 2,394.8 |
| Revenue Growth, % | 0 | -2.37 | -41.54 | 30.08 | 9.28 | -1.14 | -1.14 | -1.14 | -1.14 | -1.14 |
| EBITDA | 2,132.9 | 2,012.8 | 302.1 | -547.6 | .0 | 639.4 | 632.2 | 625.0 | 617.8 | 610.8 |
| EBITDA, % | 68.24 | 65.96 | 16.93 | -23.6 | 0 | 25.51 | 25.51 | 25.51 | 25.51 | 25.51 |
| Depreciation | 104.8 | 144.6 | 196.0 | 195.3 | 201.2 | 177.6 | 175.6 | 173.6 | 171.6 | 169.7 |
| Depreciation, % | 3.35 | 4.74 | 10.98 | 8.42 | 7.93 | 7.09 | 7.09 | 7.09 | 7.09 | 7.09 |
| EBIT | 2,028.1 | 1,868.1 | 106.1 | -742.9 | -201.2 | 461.8 | 456.6 | 451.4 | 446.2 | 441.1 |
| EBIT, % | 64.88 | 61.22 | 5.95 | -32.01 | -7.93 | 18.42 | 18.42 | 18.42 | 18.42 | 18.42 |
| Total Cash | 34,040.6 | 35,389.6 | 32,861.1 | 6,287.4 | 39,876.0 | 2,507.1 | 2,478.5 | 2,450.3 | 2,422.4 | 2,394.8 |
| Total Cash, percent | .0 | .0 | .0 | .0 | .0 | .0 | .0 | .0 | .0 | .0 |
| Account Receivables | 118.4 | 289.3 | 11,670.8 | .0 | 101.2 | 588.0 | 581.3 | 574.6 | 568.1 | 561.6 |
| Account Receivables, % | 3.79 | 9.48 | 654.16 | 0 | 3.99 | 23.45 | 23.45 | 23.45 | 23.45 | 23.45 |
| Inventories | 19,041.9 | 18,712.2 | 16,197.1 | .0 | .0 | 1,504.2 | 1,487.1 | 1,470.2 | 1,453.4 | 1,436.9 |
| Inventories, % | 609.19 | 613.17 | 907.86 | 0 | 0 | 60 | 60 | 60 | 60 | 60 |
| Accounts Payable | .0 | .0 | .0 | 1,233.1 | 1,000.6 | 464.3 | 459.0 | 453.8 | 448.6 | 443.5 |
| Accounts Payable, % | 0 | 0 | 0 | 53.14 | 39.46 | 18.52 | 18.52 | 18.52 | 18.52 | 18.52 |
| Capital Expenditure | -271.8 | -196.5 | -93.6 | -134.1 | -119.4 | -154.8 | -153.0 | -151.3 | -149.6 | -147.9 |
| Capital Expenditure, % | -8.69 | -6.44 | -5.25 | -5.78 | -4.71 | -6.17 | -6.17 | -6.17 | -6.17 | -6.17 |
| Tax Rate, % | 16.36 | 16.36 | 16.36 | 16.36 | 16.36 | 16.36 | 16.36 | 16.36 | 16.36 | 16.36 |
| EBITAT | 1,872.9 | 1,867.4 | 309.4 | -847.9 | -168.3 | 439.6 | 434.6 | 429.6 | 424.7 | 419.9 |
| Depreciation | ||||||||||
| Changes in Account Receivables | ||||||||||
| Changes in Inventories | ||||||||||
| Changes in Accounts Payable | ||||||||||
| Capital Expenditure | ||||||||||
| UFCF | -17,454.5 | 1,974.4 | -8,454.7 | 28,314.3 | -420.2 | -2,064.9 | 475.7 | 470.3 | 464.9 | 459.6 |
| WACC, % | 5.08 | 5.23 | 5.23 | 5.23 | 4.91 | 5.14 | 5.14 | 5.14 | 5.14 | 5.14 |
| PV UFCF | ||||||||||
| SUM PV UFCF | -390.7 | |||||||||
| Long Term Growth Rate, % | 2.00 | |||||||||
| Free cash flow (T + 1) | 469 | |||||||||
| Terminal Value | 14,934 | |||||||||
| Present Terminal Value | 11,624 | |||||||||
| Enterprise Value | 11,234 | |||||||||
| Net Debt | -39,876 | |||||||||
| Equity Value | 51,110 | |||||||||
| Diluted Shares Outstanding, MM | 6,358 | |||||||||
| Equity Value Per Share | 8.04 |
What You Will Receive
- Authentic Southwest Securities Data: Preloaded financial metrics – encompassing revenue to EBIT – derived from actual and projected data.
- Comprehensive Customization: Modify all key variables (yellow cells) such as WACC, growth percentage, and tax rates.
- Real-Time Valuation Adjustments: Automatic recalculations to evaluate the effects of modifications on Southwest Securities’ fair value.
- Flexible Excel Template: Designed for swift edits, scenario analysis, and in-depth forecasting.
- Efficient and Precise: Eliminate the need to construct models from the ground up while ensuring accuracy and adaptability.
Key Features
- Pre-Loaded Data: Historical financial statements and pre-filled forecasts for Southwest Securities Co., Ltd. (600369SS).
- Fully Adjustable Inputs: Customize WACC, tax rates, revenue growth, and EBITDA margins to fit your analysis.
- Instant Results: Watch the intrinsic value of Southwest Securities Co., Ltd. (600369SS) update in real time.
- Clear Visual Outputs: Dashboard charts effectively illustrate valuation results and essential metrics.
- Built for Accuracy: A reliable tool crafted for analysts, investors, and finance professionals.
How It Functions
- 1. Access the Template: Download and open the Excel file containing the preloaded data for Southwest Securities Co., Ltd. (600369SS).
- 2. Modify Assumptions: Adjust key parameters such as growth rates, WACC, and capital expenditures.
- 3. View Results Instantly: The DCF model automatically calculates intrinsic value and NPV in real-time.
- 4. Explore Scenarios: Analyze various forecasts to evaluate different valuation outcomes.
- 5. Present with Confidence: Provide professional valuation insights to reinforce your decision-making.
Why Opt for Southwest Securities Co., Ltd. (600369SS) Calculator?
- Save Time: Skip the hassle of building a DCF model from the ground up – it’s immediately ready for use.
- Enhance Accuracy: Dependable financial data and established formulas minimize valuation errors.
- Completely Customizable: Adjust the model to align with your unique assumptions and forecasts.
- User-Friendly: Intuitive charts and outputs simplify the analysis of results.
- Endorsed by Professionals: Crafted for experts who prioritize precision and efficiency.
Who Can Benefit from Our Services?
- Finance Students: Master valuation methodologies and apply them to real-world data.
- Researchers: Integrate industry-leading models into your academic projects or studies.
- Investors: Verify your investment hypotheses and evaluate valuation results for Southwest Securities Co., Ltd. (600369SS).
- Financial Analysts: Enhance your efficiency with our customizable DCF models tailored for your needs.
- Entrepreneurs: Understand the analytical practices used for evaluating major public firms like Southwest Securities Co., Ltd. (600369SS).
What This Template Includes
- Pre-Filled DCF Model: Southwest Securities Co., Ltd.’s (600369SS) financial data preloaded for immediate analysis.
- WACC Calculator: Comprehensive calculations for the Weighted Average Cost of Capital.
- Financial Ratios: Assess Southwest Securities’ profitability, leverage, and operational efficiency.
- Editable Inputs: Modify assumptions regarding growth, margins, and CAPEX to align with your scenarios.
- Financial Statements: Annual and quarterly reports to facilitate in-depth analysis.
- Interactive Dashboard: Effortlessly visualize essential valuation metrics and outcomes.
Disclaimer
All information, articles, and product details provided on this website are for general informational and educational purposes only. We do not claim any ownership over, nor do we intend to infringe upon, any trademarks, copyrights, logos, brand names, or other intellectual property mentioned or depicted on this site. Such intellectual property remains the property of its respective owners, and any references here are made solely for identification or informational purposes, without implying any affiliation, endorsement, or partnership.
We make no representations or warranties, express or implied, regarding the accuracy, completeness, or suitability of any content or products presented. Nothing on this website should be construed as legal, tax, investment, financial, medical, or other professional advice. In addition, no part of this site—including articles or product references—constitutes a solicitation, recommendation, endorsement, advertisement, or offer to buy or sell any securities, franchises, or other financial instruments, particularly in jurisdictions where such activity would be unlawful.
All content is of a general nature and may not address the specific circumstances of any individual or entity. It is not a substitute for professional advice or services. Any actions you take based on the information provided here are strictly at your own risk. You accept full responsibility for any decisions or outcomes arising from your use of this website and agree to release us from any liability in connection with your use of, or reliance upon, the content or products found herein.