
|
Shenghe Resources Holding Co., Ltd (600392.SS) Évaluation DCF |
Entièrement Modifiable: Adapté À Vos Besoins Dans Excel Ou Sheets
Conception Professionnelle: Modèles Fiables Et Conformes Aux Normes Du Secteur
Pré-Construits Pour Une Utilisation Rapide Et Efficace
Compatible MAC/PC, entièrement débloqué
Aucune Expertise N'Est Requise; Facile À Suivre
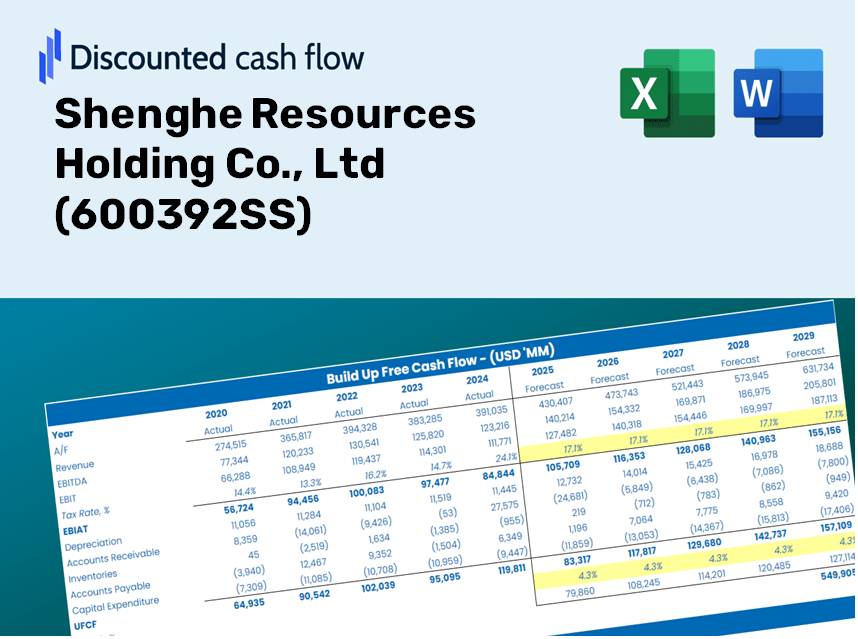
Shenghe Resources Holding Co., Ltd (600392.SS) Bundle
Améliorez votre stratégie d'investissement avec la calculatrice DCF (600392SS)! Explorez des données financières réelles pour Shenghe Resources Holding Co., Ltd, ajustez les projections et dépenses de croissance et observez instantanément comment ces modifications affectent la valeur intrinsèque de (600392SS).
Discounted Cash Flow (DCF) - (USD MM)
| Year | AY1 2020 |
AY2 2021 |
AY3 2022 |
AY4 2023 |
AY5 2024 |
FY1 2025 |
FY2 2026 |
FY3 2027 |
FY4 2028 |
FY5 2029 |
|---|---|---|---|---|---|---|---|---|---|---|
| Revenue | 8,157.3 | 10,616.3 | 16,757.9 | 17,877.4 | 11,371.0 | 11,745.5 | 12,132.4 | 12,531.9 | 12,944.7 | 13,371.0 |
| Revenue Growth, % | 0 | 30.15 | 57.85 | 6.68 | -36.39 | 3.29 | 3.29 | 3.29 | 3.29 | 3.29 |
| EBITDA | 910.5 | 1,464.2 | 2,010.1 | 672.3 | 516.6 | 1,063.0 | 1,098.0 | 1,134.2 | 1,171.5 | 1,210.1 |
| EBITDA, % | 11.16 | 13.79 | 11.99 | 3.76 | 4.54 | 9.05 | 9.05 | 9.05 | 9.05 | 9.05 |
| Depreciation | 98.5 | 67.2 | 75.2 | 114.2 | 147.0 | 99.2 | 102.4 | 105.8 | 109.3 | 112.9 |
| Depreciation, % | 1.21 | 0.63254 | 0.44901 | 0.63875 | 1.29 | 0.84416 | 0.84416 | 0.84416 | 0.84416 | 0.84416 |
| EBIT | 812.0 | 1,397.1 | 1,934.8 | 558.1 | 369.6 | 963.9 | 995.6 | 1,028.4 | 1,062.3 | 1,097.3 |
| EBIT, % | 9.95 | 13.16 | 11.55 | 3.12 | 3.25 | 8.21 | 8.21 | 8.21 | 8.21 | 8.21 |
| Total Cash | 1,357.2 | 2,296.0 | 2,670.4 | 2,563.9 | 2,576.0 | 2,142.3 | 2,212.8 | 2,285.7 | 2,361.0 | 2,438.7 |
| Total Cash, percent | .0 | .0 | .0 | .0 | .0 | .0 | .0 | .0 | .0 | .0 |
| Account Receivables | 2,426.7 | 2,232.2 | 2,004.5 | 1,429.7 | 1,295.6 | 1,929.2 | 1,992.8 | 2,058.4 | 2,126.2 | 2,196.2 |
| Account Receivables, % | 29.75 | 21.03 | 11.96 | 8 | 11.39 | 16.43 | 16.43 | 16.43 | 16.43 | 16.43 |
| Inventories | 2,765.6 | 3,687.2 | 4,731.0 | 4,885.7 | 4,455.9 | 3,838.0 | 3,964.4 | 4,095.0 | 4,229.8 | 4,369.1 |
| Inventories, % | 33.9 | 34.73 | 28.23 | 27.33 | 39.19 | 32.68 | 32.68 | 32.68 | 32.68 | 32.68 |
| Accounts Payable | 1,396.4 | 1,323.1 | 655.2 | 1,044.1 | 551.0 | 1,037.8 | 1,072.0 | 1,107.3 | 1,143.7 | 1,181.4 |
| Accounts Payable, % | 17.12 | 12.46 | 3.91 | 5.84 | 4.85 | 8.84 | 8.84 | 8.84 | 8.84 | 8.84 |
| Capital Expenditure | -160.5 | -237.5 | -371.6 | -616.5 | -725.6 | -381.8 | -394.3 | -407.3 | -420.7 | -434.6 |
| Capital Expenditure, % | -1.97 | -2.24 | -2.22 | -3.45 | -6.38 | -3.25 | -3.25 | -3.25 | -3.25 | -3.25 |
| Tax Rate, % | 31.61 | 31.61 | 31.61 | 31.61 | 31.61 | 31.61 | 31.61 | 31.61 | 31.61 | 31.61 |
| EBITAT | 569.6 | 1,140.5 | 1,603.2 | 404.8 | 252.8 | 724.0 | 747.9 | 772.5 | 797.9 | 824.2 |
| Depreciation | ||||||||||
| Changes in Account Receivables | ||||||||||
| Changes in Inventories | ||||||||||
| Changes in Accounts Payable | ||||||||||
| Capital Expenditure | ||||||||||
| UFCF | -3,288.2 | 169.7 | -177.1 | 711.5 | -255.0 | 912.4 | 300.2 | 310.1 | 320.3 | 330.8 |
| WACC, % | 7.21 | 7.25 | 7.25 | 7.22 | 7.21 | 7.23 | 7.23 | 7.23 | 7.23 | 7.23 |
| PV UFCF | ||||||||||
| SUM PV UFCF | 1,839.1 | |||||||||
| Long Term Growth Rate, % | 3.00 | |||||||||
| Free cash flow (T + 1) | 341 | |||||||||
| Terminal Value | 8,057 | |||||||||
| Present Terminal Value | 5,683 | |||||||||
| Enterprise Value | 7,522 | |||||||||
| Net Debt | 1,349 | |||||||||
| Equity Value | 6,173 | |||||||||
| Diluted Shares Outstanding, MM | 1,727 | |||||||||
| Equity Value Per Share | 3.58 |
What You Will Receive
- Customizable Excel Template: A tailored Excel-based DCF Calculator featuring pre-filled financial data for Shenghe Resources Holding Co., Ltd (600392SS).
- Accurate Data: Access to historical figures and forward-looking projections (highlighted in the yellow cells).
- Adjustable Forecasts: Modify forecast parameters such as revenue growth, EBITDA percentages, and WACC.
- Instant Calculations: Quickly observe how your inputs affect the valuation of Shenghe Resources (600392SS).
- Professional-grade Tool: Designed for investors, CFOs, consultants, and financial analysts.
- User-Friendly Interface: Organized for simplicity and ease of navigation, featuring clear step-by-step instructions.
Key Features
- Accurate Financial Data for Shenghe Resources: Gain access to reliable pre-loaded historical performance and future forecasts.
- Adjustable Forecast Parameters: Modify yellow-highlighted fields such as WACC, growth rates, and profit margins.
- Real-Time Calculations: Automatic updates to DCF, Net Present Value (NPV), and cash flow analyses.
- User-Friendly Dashboard: Intuitive charts and summaries to easily visualize your valuation outcomes.
- Designed for All Levels: An accessible and straightforward layout tailored for investors, CFOs, and consultants alike.
How It Functions
- Download: Obtain the pre-configured Excel file containing Shenghe Resources Holding Co., Ltd's (600392SS) financial data.
- Customize: Modify projections, such as revenue growth, EBITDA percentage, and WACC.
- Real-Time Updates: Intrinsic value and NPV calculations refresh automatically.
- Scenario Testing: Generate various forecasts and compare results immediately.
- Informed Decision-Making: Leverage the valuation findings to shape your investment approach.
Why Select the Shenghe Resources Calculator?
- Time Efficient: No need to build a financial model from the ground up – it’s ready to go.
- Enhanced Accuracy: Dependable financial data and formulas minimize valuation errors.
- Completely Customizable: Adjust the model to align with your specific assumptions and forecasts.
- User-Friendly: Intuitive charts and outputs facilitate straightforward analysis of results.
- Endorsed by Professionals: Crafted for experts who prioritize accuracy and ease of use.
Who Can Benefit from This Product?
- Professional Investors: Create comprehensive and trustworthy valuation models for analyzing portfolios involving Shenghe Resources Holding Co., Ltd (600392SS).
- Corporate Finance Teams: Evaluate valuation scenarios to inform strategies within your organization.
- Consultants and Advisors: Deliver precise valuation insights on Shenghe Resources Holding Co., Ltd (600392SS) to your clients.
- Students and Educators: Utilize real-world data to enhance financial modeling education and practice.
- Natural Resource Enthusiasts: Gain insights into how companies like Shenghe Resources Holding Co., Ltd (600392SS) are valued in the industry.
Overview of Template Features
- Pre-Filled DCF Model: Shenghe Resources Holding Co., Ltd's financial data preloaded for immediate use.
- WACC Calculator: Comprehensive calculations for the Weighted Average Cost of Capital.
- Financial Ratios: Analyze Shenghe's profitability, leverage, and operational efficiency.
- Editable Inputs: Adjust key assumptions such as growth rates, margins, and capital expenditures to suit your analysis.
- Financial Statements: Access annual and quarterly reports to facilitate in-depth analysis.
- Interactive Dashboard: Effortlessly visualize essential valuation metrics and results.
Disclaimer
All information, articles, and product details provided on this website are for general informational and educational purposes only. We do not claim any ownership over, nor do we intend to infringe upon, any trademarks, copyrights, logos, brand names, or other intellectual property mentioned or depicted on this site. Such intellectual property remains the property of its respective owners, and any references here are made solely for identification or informational purposes, without implying any affiliation, endorsement, or partnership.
We make no representations or warranties, express or implied, regarding the accuracy, completeness, or suitability of any content or products presented. Nothing on this website should be construed as legal, tax, investment, financial, medical, or other professional advice. In addition, no part of this site—including articles or product references—constitutes a solicitation, recommendation, endorsement, advertisement, or offer to buy or sell any securities, franchises, or other financial instruments, particularly in jurisdictions where such activity would be unlawful.
All content is of a general nature and may not address the specific circumstances of any individual or entity. It is not a substitute for professional advice or services. Any actions you take based on the information provided here are strictly at your own risk. You accept full responsibility for any decisions or outcomes arising from your use of this website and agree to release us from any liability in connection with your use of, or reliance upon, the content or products found herein.