
|
Guangdong Guanhao High-Tech Co., Ltd. (600433.SS) Évaluation DCF |
Entièrement Modifiable: Adapté À Vos Besoins Dans Excel Ou Sheets
Conception Professionnelle: Modèles Fiables Et Conformes Aux Normes Du Secteur
Pré-Construits Pour Une Utilisation Rapide Et Efficace
Compatible MAC/PC, entièrement débloqué
Aucune Expertise N'Est Requise; Facile À Suivre
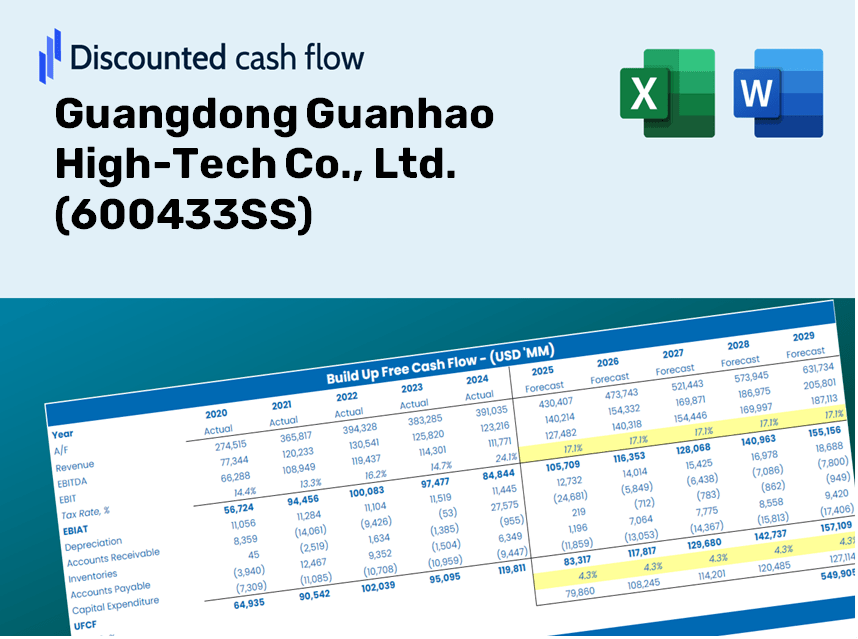
Guangdong Guanhao High-Tech Co., Ltd. (600433.SS) Bundle
Évaluez les perspectives financières de Guangdong Guanhao High-Tech Co., Ltd. Comme un expert! Cette calculatrice DCF (600433SS) vous fournit des données financières pré-remplies et la flexibilité complète pour modifier la croissance des revenus, le WACC, les marges et autres hypothèses essentielles pour correspondre à vos projections.
Discounted Cash Flow (DCF) - (USD MM)
| Year | AY1 2020 |
AY2 2021 |
AY3 2022 |
AY4 2023 |
AY5 2024 |
FY1 2025 |
FY2 2026 |
FY3 2027 |
FY4 2028 |
FY5 2029 |
|---|---|---|---|---|---|---|---|---|---|---|
| Revenue | 2,439.7 | 7,397.8 | 8,086.0 | 7,403.4 | 7,588.4 | 7,300.0 | 7,022.5 | 6,755.5 | 6,498.7 | 6,251.7 |
| Revenue Growth, % | 0 | 203.22 | 9.3 | -8.44 | 2.5 | -3.8 | -3.8 | -3.8 | -3.8 | -3.8 |
| EBITDA | 817.1 | 786.5 | 809.0 | 145.0 | 572.8 | 929.0 | 893.7 | 859.8 | 827.1 | 795.6 |
| EBITDA, % | 33.49 | 10.63 | 10 | 1.96 | 7.55 | 12.73 | 12.73 | 12.73 | 12.73 | 12.73 |
| Depreciation | 288.7 | 299.8 | 294.1 | 300.3 | 320.5 | 405.9 | 390.5 | 375.6 | 361.4 | 347.6 |
| Depreciation, % | 11.83 | 4.05 | 3.64 | 4.06 | 4.22 | 5.56 | 5.56 | 5.56 | 5.56 | 5.56 |
| EBIT | 528.4 | 486.7 | 514.9 | -155.3 | 252.2 | 523.1 | 503.2 | 484.1 | 465.7 | 448.0 |
| EBIT, % | 21.66 | 6.58 | 6.37 | -2.1 | 3.32 | 7.17 | 7.17 | 7.17 | 7.17 | 7.17 |
| Total Cash | 222.8 | 1,307.8 | 1,719.5 | 926.4 | 1,204.8 | 1,116.4 | 1,073.9 | 1,033.1 | 993.8 | 956.1 |
| Total Cash, percent | .0 | .0 | .0 | .0 | .0 | .0 | .0 | .0 | .0 | .0 |
| Account Receivables | 2,205.1 | 1,710.7 | 1,626.7 | 2,008.6 | 1,335.2 | 2,603.8 | 2,504.9 | 2,409.7 | 2,318.1 | 2,229.9 |
| Account Receivables, % | 90.38 | 23.12 | 20.12 | 27.13 | 17.59 | 35.67 | 35.67 | 35.67 | 35.67 | 35.67 |
| Inventories | 325.5 | 823.5 | 1,085.9 | 1,033.7 | 1,469.4 | 1,040.0 | 1,000.4 | 962.4 | 925.8 | 890.6 |
| Inventories, % | 13.34 | 11.13 | 13.43 | 13.96 | 19.36 | 14.25 | 14.25 | 14.25 | 14.25 | 14.25 |
| Accounts Payable | 633.6 | 1,064.1 | 143.4 | 1,581.5 | 1,386.5 | 1,193.7 | 1,148.3 | 1,104.7 | 1,062.7 | 1,022.3 |
| Accounts Payable, % | 25.97 | 14.38 | 1.77 | 21.36 | 18.27 | 16.35 | 16.35 | 16.35 | 16.35 | 16.35 |
| Capital Expenditure | -24.6 | -41.3 | -260.4 | -720.0 | -741.0 | -354.4 | -340.9 | -328.0 | -315.5 | -303.5 |
| Capital Expenditure, % | -1.01 | -0.5581 | -3.22 | -9.72 | -9.76 | -4.86 | -4.86 | -4.86 | -4.86 | -4.86 |
| Tax Rate, % | -4.17 | -4.17 | -4.17 | -4.17 | -4.17 | -4.17 | -4.17 | -4.17 | -4.17 | -4.17 |
| EBITAT | 439.4 | 412.4 | 387.7 | -34.9 | 262.7 | 382.6 | 368.0 | 354.0 | 340.6 | 327.6 |
| Depreciation | ||||||||||
| Changes in Account Receivables | ||||||||||
| Changes in Inventories | ||||||||||
| Changes in Accounts Payable | ||||||||||
| Capital Expenditure | ||||||||||
| UFCF | -1,193.6 | 1,097.9 | -677.6 | 653.9 | -115.0 | -598.0 | 510.7 | 491.3 | 472.6 | 454.6 |
| WACC, % | 6.38 | 6.4 | 6.28 | 5.6 | 6.6 | 6.25 | 6.25 | 6.25 | 6.25 | 6.25 |
| PV UFCF | ||||||||||
| SUM PV UFCF | 1,005.5 | |||||||||
| Long Term Growth Rate, % | 3.50 | |||||||||
| Free cash flow (T + 1) | 471 | |||||||||
| Terminal Value | 17,090 | |||||||||
| Present Terminal Value | 12,619 | |||||||||
| Enterprise Value | 13,625 | |||||||||
| Net Debt | 1,939 | |||||||||
| Equity Value | 11,686 | |||||||||
| Diluted Shares Outstanding, MM | 1,837 | |||||||||
| Equity Value Per Share | 6.36 |
Your Benefits
- Customizable Excel Template: A fully adaptable Excel-based DCF Calculator featuring pre-filled financial data for Guangdong Guanhao High-Tech Co., Ltd. (600433SS).
- Accurate Data: Historical performance metrics and forward-looking projections (highlighted in the yellow cells).
- Forecasting Flexibility: Alter assumptions on revenue growth, EBITDA %, and WACC to suit your analysis.
- Instant Calculations: Quickly assess how your inputs affect the valuation of Guangdong Guanhao High-Tech Co., Ltd. (600433SS).
- Professional Resource: Designed for investors, CFOs, consultants, and financial analysts.
- Intuitive Layout: Organized for straightforward navigation, complete with detailed instructions.
Key Features of Guangdong Guanhao High-Tech Co., Ltd. (600433SS)
- Authentic Financial Data: Gain access to precise historical figures and reliable future forecasts.
- Adjustable Forecast Parameters: Modify the highlighted cells for key metrics like WACC, growth rates, and profit margins.
- Automated Calculations: Benefit from real-time updates to DCF, Net Present Value (NPV), and cash flow assessments.
- User-Friendly Dashboard: View clear charts and summaries to effectively interpret your valuation outcomes.
- Suitable for All Skill Levels: Designed with a straightforward layout for investors, CFOs, and consultants alike.
How It Works
- Step 1: Download the Excel file.
- Step 2: Review the pre-filled data for Guangdong Guanhao High-Tech Co., Ltd. (600433SS) (historical and projected).
- Step 3: Modify key assumptions (highlighted in yellow) based on your analysis.
- Step 4: Observe the automatic recalculations reflecting the intrinsic value of Guangdong Guanhao High-Tech Co., Ltd. (600433SS).
- Step 5: Utilize the results for investment decisions or reporting purposes.
Why Choose the Guanhao High-Tech Calculator?
- Reliable Data: Utilizing accurate financials from Guangdong Guanhao High-Tech Co., Ltd. ensures trustworthy valuation outcomes.
- Customizable Options: Tailor essential parameters such as growth rates, WACC, and tax rates to align with your financial forecasts.
- Efficient: Pre-configured calculations save you time and eliminate the need to start from the beginning.
- Professional Quality: Crafted for investors, analysts, and consultants looking for precise tools.
- Intuitive Design: User-friendly interface and clear step-by-step guidance make it accessible for everyone.
Who Can Benefit from This Product?
- Investors: Assess the valuation of Guangdong Guanhao High-Tech Co., Ltd. (600433SS) prior to making stock transactions.
- CFOs and Financial Analysts: Enhance valuation workflows and evaluate financial forecasts.
- Startup Founders: Discover how prominent firms like Guangdong Guanhao High-Tech Co., Ltd. (600433SS) establish their market value.
- Consultants: Create expert valuation reports tailored for your clients.
- Students and Educators: Utilize real data for hands-on practice in valuation methodologies.
Contents of the Template
- Pre-Filled DCF Model: Guangdong Guanhao High-Tech Co., Ltd.'s financial data preloaded for immediate utilization.
- WACC Calculator: Comprehensive calculations for Weighted Average Cost of Capital.
- Financial Ratios: Assess Guangdong Guanhao's profitability, leverage, and operational efficiency.
- Editable Inputs: Modify assumptions like growth rates, profit margins, and capital expenditures to align with your projections.
- Financial Statements: Annual and quarterly reports to facilitate in-depth analysis.
- Interactive Dashboard: Effortlessly visualize essential valuation metrics and outcomes.
Disclaimer
All information, articles, and product details provided on this website are for general informational and educational purposes only. We do not claim any ownership over, nor do we intend to infringe upon, any trademarks, copyrights, logos, brand names, or other intellectual property mentioned or depicted on this site. Such intellectual property remains the property of its respective owners, and any references here are made solely for identification or informational purposes, without implying any affiliation, endorsement, or partnership.
We make no representations or warranties, express or implied, regarding the accuracy, completeness, or suitability of any content or products presented. Nothing on this website should be construed as legal, tax, investment, financial, medical, or other professional advice. In addition, no part of this site—including articles or product references—constitutes a solicitation, recommendation, endorsement, advertisement, or offer to buy or sell any securities, franchises, or other financial instruments, particularly in jurisdictions where such activity would be unlawful.
All content is of a general nature and may not address the specific circumstances of any individual or entity. It is not a substitute for professional advice or services. Any actions you take based on the information provided here are strictly at your own risk. You accept full responsibility for any decisions or outcomes arising from your use of this website and agree to release us from any liability in connection with your use of, or reliance upon, the content or products found herein.