
|
Long Yuan Construction Group Co., Ltd. (600491.SS) Évaluation DCF |
Entièrement Modifiable: Adapté À Vos Besoins Dans Excel Ou Sheets
Conception Professionnelle: Modèles Fiables Et Conformes Aux Normes Du Secteur
Pré-Construits Pour Une Utilisation Rapide Et Efficace
Compatible MAC/PC, entièrement débloqué
Aucune Expertise N'Est Requise; Facile À Suivre
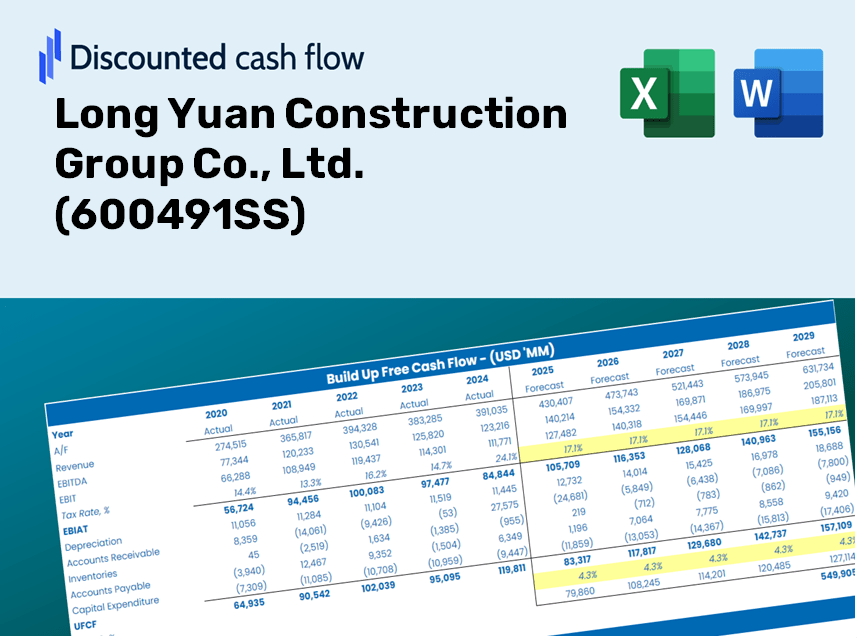
Long Yuan Construction Group Co., Ltd. (600491.SS) Bundle
Évaluez les perspectives financières de Long Yuan Construction Group Co., Ltd. (600491SS) avec une expertise! Ce calculatrice DCF (600491SS) fournit des données financières préchargées ainsi que la liberté de modifier la croissance des revenus, le WACC, les marges et d'autres hypothèses essentielles pour s'aligner sur vos projections.
Discounted Cash Flow (DCF) - (USD MM)
| Year | AY1 2020 |
AY2 2021 |
AY3 2022 |
AY4 2023 |
AY5 2024 |
FY1 2025 |
FY2 2026 |
FY3 2027 |
FY4 2028 |
FY5 2029 |
|---|---|---|---|---|---|---|---|---|---|---|
| Revenue | 17,786.7 | 19,547.8 | 14,245.9 | 9,004.2 | 9,118.8 | 10,210.2 | 11,432.3 | 12,800.7 | 14,332.8 | 16,048.4 |
| Revenue Growth, % | 0 | 9.9 | -27.12 | -36.79 | 1.27 | 11.97 | 11.97 | 11.97 | 11.97 | 11.97 |
| EBITDA | 1,373.8 | 2,420.2 | 2,116.0 | 162.2 | 1,031.1 | 981.5 | 1,099.0 | 1,230.6 | 1,377.9 | 1,542.8 |
| EBITDA, % | 7.72 | 12.38 | 14.85 | 1.8 | 11.31 | 9.61 | 9.61 | 9.61 | 9.61 | 9.61 |
| Depreciation | 47.7 | 72.5 | 65.1 | 53.8 | 53.6 | 46.6 | 52.2 | 58.4 | 65.4 | 73.2 |
| Depreciation, % | 0.26842 | 0.371 | 0.45681 | 0.5976 | 0.58735 | 0.45624 | 0.45624 | 0.45624 | 0.45624 | 0.45624 |
| EBIT | 1,326.0 | 2,347.7 | 2,050.9 | 108.4 | 977.5 | 935.0 | 1,046.9 | 1,172.2 | 1,312.5 | 1,469.6 |
| EBIT, % | 7.46 | 12.01 | 14.4 | 1.2 | 10.72 | 9.16 | 9.16 | 9.16 | 9.16 | 9.16 |
| Total Cash | 3,354.6 | 2,966.1 | 2,847.5 | 1,650.5 | 1,298.7 | 1,768.3 | 1,979.9 | 2,216.9 | 2,482.3 | 2,779.4 |
| Total Cash, percent | .0 | .0 | .0 | .0 | .0 | .0 | .0 | .0 | .0 | .0 |
| Account Receivables | 21,396.7 | 48,475.9 | 41,236.6 | 25,736.6 | 21,670.4 | 10,210.2 | 11,432.3 | 12,800.7 | 14,332.8 | 16,048.4 |
| Account Receivables, % | 120.3 | 247.99 | 289.46 | 285.83 | 237.64 | 100 | 100 | 100 | 100 | 100 |
| Inventories | 704.1 | 24.0 | 32.7 | 22.8 | 18.5 | 97.3 | 109.0 | 122.0 | 136.7 | 153.0 |
| Inventories, % | 3.96 | 0.1228 | 0.22924 | 0.25375 | 0.20299 | 0.95344 | 0.95344 | 0.95344 | 0.95344 | 0.95344 |
| Accounts Payable | 16,484.8 | 17,698.8 | 16,432.4 | 11,633.8 | 11,399.4 | 9,867.6 | 11,048.7 | 12,371.1 | 13,851.9 | 15,509.8 |
| Accounts Payable, % | 92.68 | 90.54 | 115.35 | 129.2 | 125.01 | 96.64 | 96.64 | 96.64 | 96.64 | 96.64 |
| Capital Expenditure | -346.9 | -72.2 | -45.8 | -39.9 | -49.9 | -74.1 | -83.0 | -93.0 | -104.1 | -116.5 |
| Capital Expenditure, % | -1.95 | -0.36928 | -0.3217 | -0.4427 | -0.54729 | -0.72622 | -0.72622 | -0.72622 | -0.72622 | -0.72622 |
| Tax Rate, % | -17.01 | -17.01 | -17.01 | -17.01 | -17.01 | -17.01 | -17.01 | -17.01 | -17.01 | -17.01 |
| EBITAT | 955.1 | 1,663.4 | 1,506.0 | 100.1 | 1,143.8 | 764.1 | 855.6 | 958.0 | 1,072.7 | 1,201.1 |
| Depreciation | ||||||||||
| Changes in Account Receivables | ||||||||||
| Changes in Inventories | ||||||||||
| Changes in Accounts Payable | ||||||||||
| Capital Expenditure | ||||||||||
| UFCF | -4,960.0 | -23,521.3 | 7,489.4 | 10,825.4 | 4,983.6 | 10,586.1 | 772.1 | 864.5 | 967.9 | 1,083.8 |
| WACC, % | 5.39 | 5.32 | 5.48 | 6.63 | 7.09 | 5.98 | 5.98 | 5.98 | 5.98 | 5.98 |
| PV UFCF | ||||||||||
| SUM PV UFCF | 12,979.5 | |||||||||
| Long Term Growth Rate, % | 3.00 | |||||||||
| Free cash flow (T + 1) | 1,116 | |||||||||
| Terminal Value | 37,411 | |||||||||
| Present Terminal Value | 27,977 | |||||||||
| Enterprise Value | 40,956 | |||||||||
| Net Debt | 18,900 | |||||||||
| Equity Value | 22,057 | |||||||||
| Diluted Shares Outstanding, MM | 1,543 | |||||||||
| Equity Value Per Share | 14.30 |
What You'll Receive
- Authentic Long Yuan Data: Preloaded financial metrics – from revenue to EBIT – based on actual and forecasted figures.
- Comprehensive Customization: Modify all key parameters (yellow cells), including WACC, growth %, and tax rates.
- Immediate Valuation Updates: Automatic recalculations to assess the effects of changes on Long Yuan's fair value.
- Flexible Excel Template: Designed for quick modifications, scenario analysis, and detailed projections.
- Efficient and Precise: Avoid the hassle of building models from the ground up while ensuring accuracy and adaptability.
Key Features
- Pre-Loaded Data: Historical financial statements and pre-filled forecasts for Long Yuan Construction Group Co., Ltd. (600491SS).
- Fully Adjustable Inputs: Customize WACC, tax rates, revenue growth, and EBITDA margins to fit your analysis.
- Instant Results: Watch the intrinsic value of Long Yuan Construction Group Co., Ltd. (600491SS) recalculate in real time.
- Clear Visual Outputs: Utilize dashboard charts to visualize valuation results and essential metrics.
- Built for Accuracy: A reliable tool designed for analysts, investors, and finance professionals.
How It Works
- Download: Access the pre-built Excel file featuring Long Yuan Construction Group Co., Ltd.'s (600491SS) financial data.
- Customize: Modify forecasts such as revenue growth, EBITDA %, and WACC to fit your analysis.
- Update Automatically: Intrinsic value and NPV calculations refresh in real-time as adjustments are made.
- Test Scenarios: Generate various projections and instantly compare their outcomes.
- Make Decisions: Leverage the valuation results to inform your investment choices.
Why Choose This Calculator for Long Yuan Construction Group Co., Ltd. (600491SS)?
- Reliable Data: Utilize real financial data from Long Yuan Construction to achieve dependable valuation results.
- Tailorable: Modify essential parameters such as growth rates, WACC, and tax rates to align with your forecasts.
- Efficient: Built-in calculations save you the hassle of starting from scratch.
- Professional-Quality Tool: Crafted for investors, analysts, and consultants focused on Long Yuan Construction.
- User-Friendly: A straightforward layout and comprehensive instructions make it accessible for all users.
Who Can Benefit from This Product?
- Investors: Develop comprehensive and trustworthy valuation models for assessing investment opportunities in Long Yuan Construction Group Co., Ltd. (600491SS).
- Corporate Finance Departments: Evaluate valuation scenarios to inform and enhance corporate strategy.
- Financial Consultants: Deliver precise valuation analyses for clients interested in Long Yuan Construction Group Co., Ltd. (600491SS).
- Students and Instructors: Utilize real-time financial data to learn and teach valuation and financial modeling techniques.
- Industry Analysts: Gain insights into how companies like Long Yuan Construction Group Co., Ltd. (600491SS) are appraised within the construction sector.
Contents of the Template
- Preloaded Long Yuan Data: Historical and forecasted financial information, including revenue, EBIT, and capital expenditures.
- DCF and WACC Models: Professional templates for computing intrinsic value and Weighted Average Cost of Capital.
- Editable Inputs: Cells highlighted in yellow for customizing revenue growth, tax rates, and discount rates.
- Financial Statements: Detailed annual and quarterly financial statements for in-depth analysis.
- Key Ratios: Ratios for profitability, leverage, and efficiency to assess performance.
- Dashboard and Charts: Visual representations of valuation results and underlying assumptions.
Disclaimer
All information, articles, and product details provided on this website are for general informational and educational purposes only. We do not claim any ownership over, nor do we intend to infringe upon, any trademarks, copyrights, logos, brand names, or other intellectual property mentioned or depicted on this site. Such intellectual property remains the property of its respective owners, and any references here are made solely for identification or informational purposes, without implying any affiliation, endorsement, or partnership.
We make no representations or warranties, express or implied, regarding the accuracy, completeness, or suitability of any content or products presented. Nothing on this website should be construed as legal, tax, investment, financial, medical, or other professional advice. In addition, no part of this site—including articles or product references—constitutes a solicitation, recommendation, endorsement, advertisement, or offer to buy or sell any securities, franchises, or other financial instruments, particularly in jurisdictions where such activity would be unlawful.
All content is of a general nature and may not address the specific circumstances of any individual or entity. It is not a substitute for professional advice or services. Any actions you take based on the information provided here are strictly at your own risk. You accept full responsibility for any decisions or outcomes arising from your use of this website and agree to release us from any liability in connection with your use of, or reliance upon, the content or products found herein.