
|
Fiberhome Telecommunication Technologies Co., Ltd. (600498.SS) Valation DCF |
Entièrement Modifiable: Adapté À Vos Besoins Dans Excel Ou Sheets
Conception Professionnelle: Modèles Fiables Et Conformes Aux Normes Du Secteur
Pré-Construits Pour Une Utilisation Rapide Et Efficace
Compatible MAC/PC, entièrement débloqué
Aucune Expertise N'Est Requise; Facile À Suivre
Fiberhome Telecommunication Technologies Co., Ltd. (600498.SS) Bundle
Vous cherchez à évaluer la valeur intrinsèque de FiberHome Telecommunication Technologies Co., Ltd.? Notre calculatrice DCF (600498SS) intègre des données du monde réel avec des options de personnalisation complètes, vous permettant d'affiner vos prévisions et d'améliorer vos décisions d'investissement.
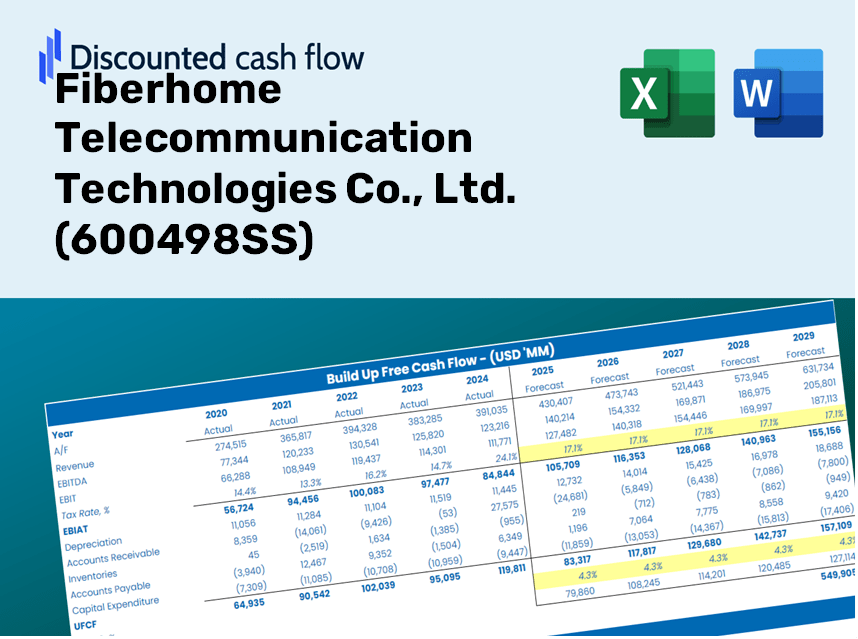
Discounted Cash Flow (DCF) - (USD MM)
| Year | AY1 2020 |
AY2 2021 |
AY3 2022 |
AY4 2023 |
AY5 2024 |
FY1 2025 |
FY2 2026 |
FY3 2027 |
FY4 2028 |
FY5 2029 |
|---|---|---|---|---|---|---|---|---|---|---|
| Revenue | 21,074.4 | 26,340.6 | 30,917.9 | 31,129.6 | 28,548.8 | 31,029.7 | 33,726.2 | 36,657.0 | 39,842.5 | 43,304.8 |
| Revenue Growth, % | 0 | 24.99 | 17.38 | 0.68476 | -8.29 | 8.69 | 8.69 | 8.69 | 8.69 | 8.69 |
| EBITDA | 846.0 | 1,035.6 | 1,249.3 | 1,395.9 | 1,834.8 | 1,421.0 | 1,544.5 | 1,678.8 | 1,824.6 | 1,983.2 |
| EBITDA, % | 4.01 | 3.93 | 4.04 | 4.48 | 6.43 | 4.58 | 4.58 | 4.58 | 4.58 | 4.58 |
| Depreciation | 669.1 | 648.5 | 722.2 | 872.0 | 794.0 | 841.2 | 914.3 | 993.8 | 1,080.1 | 1,174.0 |
| Depreciation, % | 3.17 | 2.46 | 2.34 | 2.8 | 2.78 | 2.71 | 2.71 | 2.71 | 2.71 | 2.71 |
| EBIT | 176.9 | 387.1 | 527.1 | 524.0 | 1,040.9 | 579.8 | 630.2 | 685.0 | 744.5 | 809.2 |
| EBIT, % | 0.83929 | 1.47 | 1.7 | 1.68 | 3.65 | 1.87 | 1.87 | 1.87 | 1.87 | 1.87 |
| Total Cash | 3,970.1 | 4,722.3 | 4,389.0 | 5,207.7 | 5,243.8 | 5,340.8 | 5,804.9 | 6,309.3 | 6,857.6 | 7,453.5 |
| Total Cash, percent | .0 | .0 | .0 | .0 | .0 | .0 | .0 | .0 | .0 | .0 |
| Account Receivables | .0 | 4,944.6 | 7,552.5 | 14,445.8 | 17,461.5 | 9,356.6 | 10,169.7 | 11,053.5 | 12,014.0 | 13,058.0 |
| Account Receivables, % | 0 | 18.77 | 24.43 | 46.41 | 61.16 | 30.15 | 30.15 | 30.15 | 30.15 | 30.15 |
| Inventories | 13,573.8 | 14,605.1 | 14,390.2 | 9,718.9 | 9,329.2 | 14,292.2 | 15,534.2 | 16,884.1 | 18,351.3 | 19,946.1 |
| Inventories, % | 64.41 | 55.45 | 46.54 | 31.22 | 32.68 | 46.06 | 46.06 | 46.06 | 46.06 | 46.06 |
| Accounts Payable | 6,499.9 | 3,412.4 | 14,019.2 | 3,653.4 | 14,506.0 | 9,413.7 | 10,231.7 | 11,120.9 | 12,087.3 | 13,137.7 |
| Accounts Payable, % | 30.84 | 12.95 | 45.34 | 11.74 | 50.81 | 30.34 | 30.34 | 30.34 | 30.34 | 30.34 |
| Capital Expenditure | -962.5 | -700.6 | -732.8 | -749.9 | -1,368.7 | -1,042.6 | -1,133.2 | -1,231.7 | -1,338.7 | -1,455.0 |
| Capital Expenditure, % | -4.57 | -2.66 | -2.37 | -2.41 | -4.79 | -3.36 | -3.36 | -3.36 | -3.36 | -3.36 |
| Tax Rate, % | 11.29 | 11.29 | 11.29 | 11.29 | 11.29 | 11.29 | 11.29 | 11.29 | 11.29 | 11.29 |
| EBITAT | 88.1 | 227.1 | 396.3 | 455.6 | 923.4 | 416.7 | 452.9 | 492.3 | 535.0 | 581.5 |
| Depreciation | ||||||||||
| Changes in Account Receivables | ||||||||||
| Changes in Inventories | ||||||||||
| Changes in Accounts Payable | ||||||||||
| Capital Expenditure | ||||||||||
| UFCF | -7,279.1 | -8,888.4 | 8,599.6 | -12,010.3 | 8,575.3 | -1,735.1 | -1,003.0 | -1,090.2 | -1,184.9 | -1,287.9 |
| WACC, % | 4.63 | 4.76 | 4.99 | 5.16 | 5.18 | 4.94 | 4.94 | 4.94 | 4.94 | 4.94 |
| PV UFCF | ||||||||||
| SUM PV UFCF | -5,496.0 | |||||||||
| Long Term Growth Rate, % | 2.00 | |||||||||
| Free cash flow (T + 1) | -1,314 | |||||||||
| Terminal Value | -44,624 | |||||||||
| Present Terminal Value | -35,058 | |||||||||
| Enterprise Value | -40,554 | |||||||||
| Net Debt | 1,873 | |||||||||
| Equity Value | -42,426 | |||||||||
| Diluted Shares Outstanding, MM | 1,152 | |||||||||
| Equity Value Per Share | -36.83 |
What You Will Receive
- Genuine Fiberhome Financial Data: Comprehensive historical and projected figures for precise valuation.
- Customizable Parameters: Adjust WACC, tax rates, revenue growth, and capital expenditures to fit your analysis.
- Automated Calculations: Real-time calculations of intrinsic value and NPV.
- Scenario Evaluation: Explore various scenarios to assess the future performance of Fiberhome (600498SS).
- User-Friendly Interface: Designed for professionals but easy enough for beginners to navigate.
Key Features
- Pre-Loaded Data: Fiberhome’s historical financial statements and pre-filled forecasts.
- Fully Adjustable Inputs: Customize WACC, tax rates, revenue growth, and EBITDA margins.
- Instant Results: Watch Fiberhome’s intrinsic value recalculate in real time.
- Clear Visual Outputs: Dashboard charts illustrate valuation results and key metrics.
- Built for Accuracy: A professional tool designed for analysts, investors, and finance experts.
How It Operates
- Download the Template: Gain immediate access to the Excel-based Fiberhome DCF Calculator for [600498SS].
- Input Your Assumptions: Modify the yellow-highlighted cells for growth rates, WACC, margins, and more.
- Instant Calculations: The model swiftly updates Fiberhome's intrinsic value.
- Test Scenarios: Experiment with various assumptions to assess potential valuation variations.
- Analyze and Decide: Utilize the outcomes to inform your investment or financial analysis decisions.
Why Choose This Calculator for Fiberhome Telecommunication Technologies Co., Ltd. (600498SS)?
- All-in-One Solution: Integrates DCF, WACC, and key financial ratio analyses in a single platform.
- Flexible Customization: Modify the yellow-highlighted fields to explore different scenarios.
- In-Depth Analysis: Automatically determines Fiberhome's intrinsic value and Net Present Value.
- Data-Driven Insights: Comes with historical and forecasted data for precise calculations.
- Designed for Professionals: Perfect for financial analysts, investors, and business consultants.
Who Can Benefit from Fiberhome Telecommunication Technologies Co., Ltd. (600498SS)?
- Investors: Enhance your investment strategies with advanced insights from our technology solutions.
- Financial Analysts: Streamline your analysis using our tailored financial models designed for efficiency.
- Consultants: Easily modify our resources for impactful client proposals and presentations.
- Telecommunication Enthusiasts: Expand your knowledge of industry practices and innovations through practical examples.
- Educators and Students: Utilize our tools as a hands-on resource in telecommunications and technology courses.
Contents of the Template
- Pre-Filled Data: Comprehensive historical financials and forecasts for Fiberhome Telecommunication Technologies Co., Ltd. (600498SS).
- Discounted Cash Flow Model: An editable DCF valuation model featuring automated calculations.
- Weighted Average Cost of Capital (WACC): A dedicated worksheet for WACC calculations using customized inputs.
- Key Financial Ratios: Evaluate Fiberhome's profitability, efficiency, and leverage metrics.
- Customizable Inputs: Easily modify revenue growth, profit margins, and tax rates.
- User-Friendly Dashboard: Visual representations of key valuation outcomes through charts and tables.
Disclaimer
All information, articles, and product details provided on this website are for general informational and educational purposes only. We do not claim any ownership over, nor do we intend to infringe upon, any trademarks, copyrights, logos, brand names, or other intellectual property mentioned or depicted on this site. Such intellectual property remains the property of its respective owners, and any references here are made solely for identification or informational purposes, without implying any affiliation, endorsement, or partnership.
We make no representations or warranties, express or implied, regarding the accuracy, completeness, or suitability of any content or products presented. Nothing on this website should be construed as legal, tax, investment, financial, medical, or other professional advice. In addition, no part of this site—including articles or product references—constitutes a solicitation, recommendation, endorsement, advertisement, or offer to buy or sell any securities, franchises, or other financial instruments, particularly in jurisdictions where such activity would be unlawful.
All content is of a general nature and may not address the specific circumstances of any individual or entity. It is not a substitute for professional advice or services. Any actions you take based on the information provided here are strictly at your own risk. You accept full responsibility for any decisions or outcomes arising from your use of this website and agree to release us from any liability in connection with your use of, or reliance upon, the content or products found herein.