
|
Fangda Carbon New Material Co., Ltd (600516.SS) Évaluation DCF |
Entièrement Modifiable: Adapté À Vos Besoins Dans Excel Ou Sheets
Conception Professionnelle: Modèles Fiables Et Conformes Aux Normes Du Secteur
Pré-Construits Pour Une Utilisation Rapide Et Efficace
Compatible MAC/PC, entièrement débloqué
Aucune Expertise N'Est Requise; Facile À Suivre
FangDa Carbon New Material Co.,Ltd (600516.SS) Bundle
Que vous soyez un investisseur ou un analyste, cette calculatrice DCF (600516SS) est votre outil ultime pour une évaluation précise. Préchargé avec Fangda Carbon New Material Co., les données réelles de Ltd, vous pouvez ajuster les prévisions et voir les effets immédiatement.
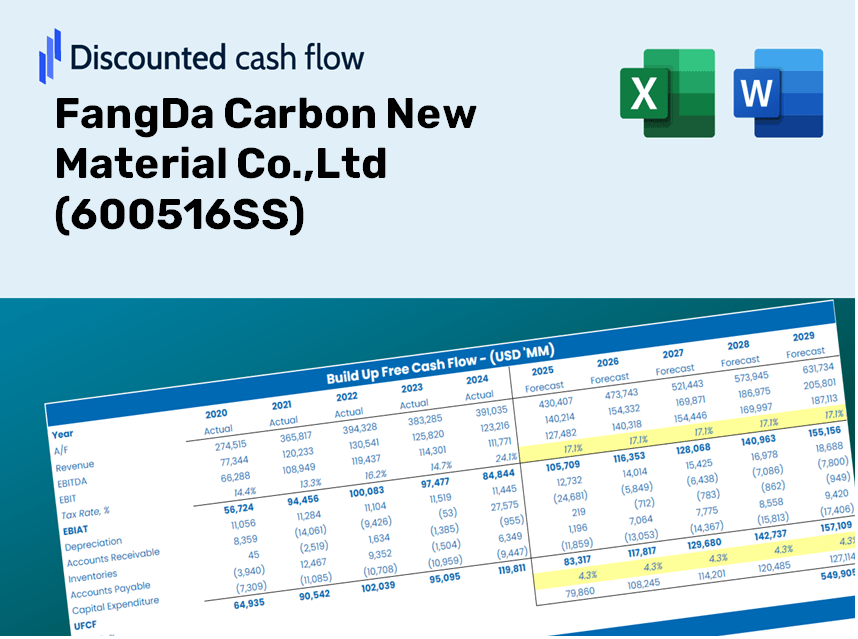
Discounted Cash Flow (DCF) - (USD MM)
| Year | AY1 2020 |
AY2 2021 |
AY3 2022 |
AY4 2023 |
AY5 2024 |
FY1 2025 |
FY2 2026 |
FY3 2027 |
FY4 2028 |
FY5 2029 |
|---|---|---|---|---|---|---|---|---|---|---|
| Revenue | 3,539.2 | 4,651.8 | 5,320.3 | 5,131.9 | 3,872.0 | 4,043.5 | 4,222.7 | 4,409.7 | 4,605.0 | 4,809.0 |
| Revenue Growth, % | 0 | 31.44 | 14.37 | -3.54 | -24.55 | 4.43 | 4.43 | 4.43 | 4.43 | 4.43 |
| EBITDA | 545.7 | 1,001.0 | 961.8 | 604.7 | 188.9 | 579.7 | 605.3 | 632.1 | 660.1 | 689.4 |
| EBITDA, % | 15.42 | 21.52 | 18.08 | 11.78 | 4.88 | 14.34 | 14.34 | 14.34 | 14.34 | 14.34 |
| Depreciation | 190.8 | 237.4 | 266.9 | 309.0 | 314.2 | 239.7 | 250.4 | 261.5 | 273.0 | 285.1 |
| Depreciation, % | 5.39 | 5.1 | 5.02 | 6.02 | 8.11 | 5.93 | 5.93 | 5.93 | 5.93 | 5.93 |
| EBIT | 355.0 | 763.6 | 694.8 | 295.7 | -125.3 | 339.9 | 355.0 | 370.7 | 387.1 | 404.3 |
| EBIT, % | 10.03 | 16.42 | 13.06 | 5.76 | -3.24 | 8.41 | 8.41 | 8.41 | 8.41 | 8.41 |
| Total Cash | 9,842.4 | 8,395.4 | 4,697.4 | 6,777.8 | 6,469.9 | 3,948.9 | 4,123.8 | 4,306.4 | 4,497.2 | 4,696.4 |
| Total Cash, percent | .0 | .0 | .0 | .0 | .0 | .0 | .0 | .0 | .0 | .0 |
| Account Receivables | 1,625.8 | 1,824.6 | 2,081.3 | 1,803.7 | 1,214.7 | 1,543.0 | 1,611.4 | 1,682.7 | 1,757.3 | 1,835.1 |
| Account Receivables, % | 45.94 | 39.22 | 39.12 | 35.15 | 31.37 | 38.16 | 38.16 | 38.16 | 38.16 | 38.16 |
| Inventories | 1,335.0 | 1,738.2 | 2,298.8 | 1,867.2 | 1,544.8 | 1,573.5 | 1,643.2 | 1,716.0 | 1,792.0 | 1,871.4 |
| Inventories, % | 37.72 | 37.37 | 43.21 | 36.38 | 39.9 | 38.92 | 38.92 | 38.92 | 38.92 | 38.92 |
| Accounts Payable | 595.8 | 744.8 | 1,097.6 | 866.1 | 178.4 | 606.2 | 633.1 | 661.1 | 690.4 | 721.0 |
| Accounts Payable, % | 16.83 | 16.01 | 20.63 | 16.88 | 4.61 | 14.99 | 14.99 | 14.99 | 14.99 | 14.99 |
| Capital Expenditure | -200.6 | -154.3 | -152.9 | -166.8 | -120.1 | -147.3 | -153.8 | -160.6 | -167.7 | -175.1 |
| Capital Expenditure, % | -5.67 | -3.32 | -2.87 | -3.25 | -3.1 | -3.64 | -3.64 | -3.64 | -3.64 | -3.64 |
| Tax Rate, % | 2.64 | 2.64 | 2.64 | 2.64 | 2.64 | 2.64 | 2.64 | 2.64 | 2.64 | 2.64 |
| EBITAT | 294.0 | 622.4 | 506.7 | 240.4 | -122.0 | 282.7 | 295.3 | 308.3 | 322.0 | 336.3 |
| Depreciation | ||||||||||
| Changes in Account Receivables | ||||||||||
| Changes in Inventories | ||||||||||
| Changes in Accounts Payable | ||||||||||
| Capital Expenditure | ||||||||||
| UFCF | -2,080.7 | 252.6 | 156.0 | 860.3 | 295.8 | 446.0 | 280.7 | 293.1 | 306.1 | 319.6 |
| WACC, % | 6.28 | 6.28 | 6.26 | 6.28 | 6.31 | 6.28 | 6.28 | 6.28 | 6.28 | 6.28 |
| PV UFCF | ||||||||||
| SUM PV UFCF | 1,387.8 | |||||||||
| Long Term Growth Rate, % | 3.00 | |||||||||
| Free cash flow (T + 1) | 329 | |||||||||
| Terminal Value | 10,033 | |||||||||
| Present Terminal Value | 7,399 | |||||||||
| Enterprise Value | 8,787 | |||||||||
| Net Debt | -4,914 | |||||||||
| Equity Value | 13,701 | |||||||||
| Diluted Shares Outstanding, MM | 3,720 | |||||||||
| Equity Value Per Share | 3.68 |
What You Will Receive
- Accurate 600516SS Financials: Access to historical and projected data for precise valuation.
- Customizable Inputs: Adjust WACC, tax rates, revenue growth, and capital expenditures as needed.
- Automatic Calculations: Intrinsic value and NPV are computed in real-time.
- Scenario Analysis: Analyze various scenarios to assess FangDa Carbon's future performance.
- User-Friendly Design: Designed for professionals, yet easy for beginners to navigate.
Key Features
- Customizable Forecast Inputs: Adjust essential metrics such as revenue growth, profit margins, and capital expenditures.
- Instant DCF Valuation: Quickly computes intrinsic value, NPV, and additional financial metrics.
- High-Precision Accuracy: Incorporates FangDa Carbon’s actual financial data for dependable valuation results.
- Simplified Scenario Analysis: Effortlessly explore various assumptions and analyze their impacts.
- Efficiency Booster: Remove the hassle of creating intricate valuation models from the ground up.
How It Works
- Download: Obtain the pre-configured Excel file containing FangDa Carbon New Material Co., Ltd's (600516SS) financial data.
- Customize: Modify projections, such as revenue growth, EBITDA percentage, and WACC.
- Update Automatically: Watch as intrinsic value and NPV calculations refresh in real-time.
- Test Scenarios: Develop various projections and instantly compare the results.
- Make Decisions: Leverage the valuation outcomes to inform your investment strategies.
Why Opt for FangDa Carbon New Material Co., Ltd's Calculator?
- Save Time: No more starting from scratch with DCF models – it's immediately available for your use.
- Enhance Accuracy: Dependable financial data and formulas minimize valuation errors.
- Completely Customizable: Adjust the model to suit your specific assumptions and forecasts.
- User-Friendly: Intuitive charts and outputs allow for straightforward analysis of results.
- Endorsed by Professionals: Designed for experts who prioritize precision and ease of use.
Who Can Benefit from This Product?
- Investors: Accurately assess the fair value of FangDa Carbon New Material Co., Ltd (600516SS) before making investment choices.
- CFOs: Utilize a professional-grade DCF model for financial reporting and analysis tailored to FangDa Carbon New Material Co., Ltd (600516SS).
- Consultants: Easily customize the template for valuation reports specific to FangDa Carbon New Material Co., Ltd (600516SS) for your clients.
- Entrepreneurs: Discover financial modeling techniques employed by leading companies, including FangDa Carbon New Material Co., Ltd (600516SS).
- Educators: Incorporate it as an educational resource to explain valuation methodologies using FangDa Carbon New Material Co., Ltd (600516SS) as a case study.
Contents of the Template
- Preloaded FDCM Data: Historical and projected financial information, including revenue, EBIT, and capital expenditures.
- DCF and WACC Models: Advanced spreadsheets for calculating intrinsic value and Weighted Average Cost of Capital.
- Editable Inputs: Yellow-highlighted fields for modifying revenue growth, tax rates, and discount rates.
- Financial Statements: Detailed annual and quarterly financials for in-depth analysis.
- Key Ratios: Metrics for profitability, leverage, and efficiency to assess performance.
- Dashboard and Charts: Visual representations of valuation results and underlying assumptions.
Disclaimer
All information, articles, and product details provided on this website are for general informational and educational purposes only. We do not claim any ownership over, nor do we intend to infringe upon, any trademarks, copyrights, logos, brand names, or other intellectual property mentioned or depicted on this site. Such intellectual property remains the property of its respective owners, and any references here are made solely for identification or informational purposes, without implying any affiliation, endorsement, or partnership.
We make no representations or warranties, express or implied, regarding the accuracy, completeness, or suitability of any content or products presented. Nothing on this website should be construed as legal, tax, investment, financial, medical, or other professional advice. In addition, no part of this site—including articles or product references—constitutes a solicitation, recommendation, endorsement, advertisement, or offer to buy or sell any securities, franchises, or other financial instruments, particularly in jurisdictions where such activity would be unlawful.
All content is of a general nature and may not address the specific circumstances of any individual or entity. It is not a substitute for professional advice or services. Any actions you take based on the information provided here are strictly at your own risk. You accept full responsibility for any decisions or outcomes arising from your use of this website and agree to release us from any liability in connection with your use of, or reliance upon, the content or products found herein.