
|
Sunyard Technology Co., Ltd (600571.SS) Valation DCF |
Entièrement Modifiable: Adapté À Vos Besoins Dans Excel Ou Sheets
Conception Professionnelle: Modèles Fiables Et Conformes Aux Normes Du Secteur
Pré-Construits Pour Une Utilisation Rapide Et Efficace
Compatible MAC/PC, entièrement débloqué
Aucune Expertise N'Est Requise; Facile À Suivre
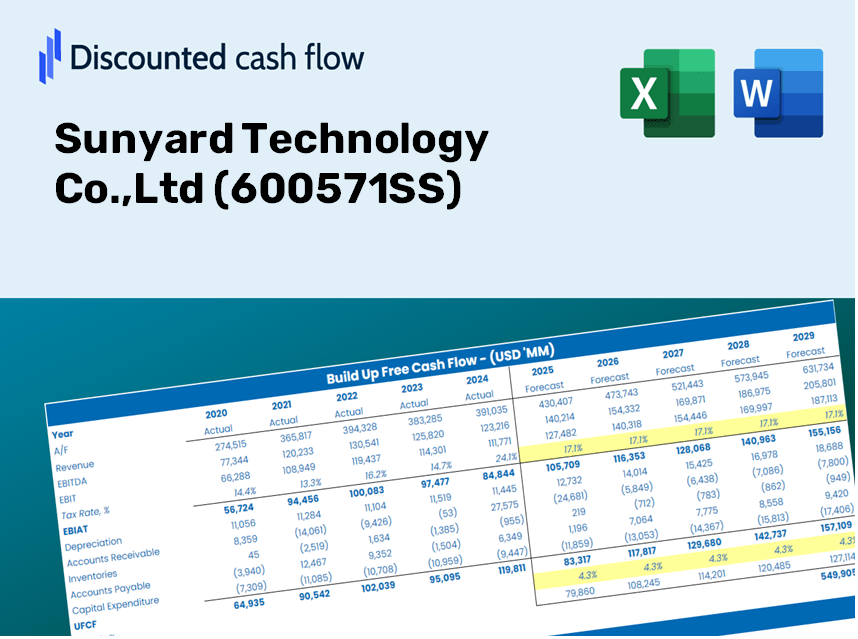
Sunyard Technology Co.,Ltd (600571.SS) Bundle
Que vous soyez un investisseur ou un analyste, cette calculatrice DCF (600571SS) est votre outil de référence pour une évaluation précise. Avec de vraies données de Sunyard Technology Co., Ltd, vous pouvez ajuster les prévisions et observer instantanément les effets.
Discounted Cash Flow (DCF) - (USD MM)
| Year | AY1 2020 |
AY2 2021 |
AY3 2022 |
AY4 2023 |
AY5 2024 |
FY1 2025 |
FY2 2026 |
FY3 2027 |
FY4 2028 |
FY5 2029 |
|---|---|---|---|---|---|---|---|---|---|---|
| Revenue | 1,266.2 | 1,537.0 | 1,538.0 | 2,128.6 | 1,967.2 | 2,224.2 | 2,514.8 | 2,843.4 | 3,215.0 | 3,635.1 |
| Revenue Growth, % | 0 | 21.38 | 0.06800088 | 38.4 | -7.58 | 13.07 | 13.07 | 13.07 | 13.07 | 13.07 |
| EBITDA | 4.4 | 3.7 | -195.1 | 91.1 | 31.7 | -27.6 | -31.2 | -35.3 | -39.9 | -45.2 |
| EBITDA, % | 0.34448 | 0.23964 | -12.69 | 4.28 | 1.61 | -1.24 | -1.24 | -1.24 | -1.24 | -1.24 |
| Depreciation | 11.2 | 7.2 | 6.6 | 1.9 | 4.2 | 9.2 | 10.5 | 11.8 | 13.4 | 15.1 |
| Depreciation, % | 0.88348 | 0.46649 | 0.42606 | 0.08824558 | 0.21491 | 0.41584 | 0.41584 | 0.41584 | 0.41584 | 0.41584 |
| EBIT | -6.8 | -3.5 | -201.7 | 89.2 | 27.5 | -36.9 | -41.7 | -47.1 | -53.3 | -60.3 |
| EBIT, % | -0.53901 | -0.22685 | -13.11 | 4.19 | 1.4 | -1.66 | -1.66 | -1.66 | -1.66 | -1.66 |
| Total Cash | 1,019.0 | 1,252.1 | 981.0 | 949.5 | 910.8 | 1,408.5 | 1,592.6 | 1,800.7 | 2,036.0 | 2,302.0 |
| Total Cash, percent | .0 | .0 | .0 | .0 | .0 | .0 | .0 | .0 | .0 | .0 |
| Account Receivables | 119.4 | 128.3 | 142.7 | 230.4 | 321.6 | 241.2 | 272.7 | 308.4 | 348.7 | 394.2 |
| Account Receivables, % | 9.43 | 8.35 | 9.28 | 10.83 | 16.35 | 10.85 | 10.85 | 10.85 | 10.85 | 10.85 |
| Inventories | 112.7 | 100.4 | 134.5 | 61.0 | 100.0 | 142.9 | 161.6 | 182.7 | 206.6 | 233.6 |
| Inventories, % | 8.9 | 6.54 | 8.75 | 2.87 | 5.08 | 6.43 | 6.43 | 6.43 | 6.43 | 6.43 |
| Accounts Payable | 85.9 | 67.6 | 71.8 | 58.2 | 60.3 | 96.3 | 108.9 | 123.1 | 139.2 | 157.4 |
| Accounts Payable, % | 6.78 | 4.4 | 4.67 | 2.73 | 3.07 | 4.33 | 4.33 | 4.33 | 4.33 | 4.33 |
| Capital Expenditure | -3.8 | -9.4 | -5.7 | -7.3 | -7.3 | -8.9 | -10.0 | -11.4 | -12.8 | -14.5 |
| Capital Expenditure, % | -0.30137 | -0.61206 | -0.36879 | -0.34468 | -0.36952 | -0.39928 | -0.39928 | -0.39928 | -0.39928 | -0.39928 |
| Tax Rate, % | -60.87 | -60.87 | -60.87 | -60.87 | -60.87 | -60.87 | -60.87 | -60.87 | -60.87 | -60.87 |
| EBITAT | -8.2 | -2.5 | -187.7 | 87.4 | 44.2 | -34.2 | -38.6 | -43.7 | -49.4 | -55.9 |
| Depreciation | ||||||||||
| Changes in Account Receivables | ||||||||||
| Changes in Inventories | ||||||||||
| Changes in Accounts Payable | ||||||||||
| Capital Expenditure | ||||||||||
| UFCF | -147.1 | -19.7 | -231.1 | 54.0 | -86.8 | 39.6 | -75.8 | -85.7 | -96.9 | -109.6 |
| WACC, % | 7.39 | 7.39 | 7.39 | 7.39 | 7.39 | 7.39 | 7.39 | 7.39 | 7.39 | 7.39 |
| PV UFCF | ||||||||||
| SUM PV UFCF | -247.7 | |||||||||
| Long Term Growth Rate, % | 2.00 | |||||||||
| Free cash flow (T + 1) | -112 | |||||||||
| Terminal Value | -2,074 | |||||||||
| Present Terminal Value | -1,452 | |||||||||
| Enterprise Value | -1,700 | |||||||||
| Net Debt | -167 | |||||||||
| Equity Value | -1,532 | |||||||||
| Diluted Shares Outstanding, MM | 467 | |||||||||
| Equity Value Per Share | -3.28 |
What You Will Receive
- Authentic Sunyard Data: Preloaded financial information – encompassing revenue to EBIT – derived from actual and forecasted figures.
- Comprehensive Customization: Modify all essential parameters (yellow cells) such as WACC, growth percentage, and tax rates.
- Immediate Valuation Adjustments: Automatic recalculations to assess the influence of changes on Sunyard’s fair value.
- Flexible Excel Template: Designed for swift modifications, scenario analysis, and thorough forecasting.
- Efficient and Precise: Avoid the hassle of constructing models from scratch while ensuring accuracy and adaptability.
Key Features
- Accurate Financial Data: Gain access to reliable historical figures and future forecasts specific to Sunyard Technology Co., Ltd (600571SS).
- Editable Forecast Parameters: Customize yellow-highlighted fields such as WACC, growth rates, and profit margins to tailor your analysis.
- Automatic Calculations: Enjoy real-time updates on DCF, Net Present Value (NPV), and cash flow evaluations.
- User-Friendly Dashboard: Utilize clear charts and summaries to effectively present your valuation findings.
- Suitable for All Skill Levels: An intuitive design crafted for investors, CFOs, and consultants alike, ensuring ease of use for both novices and experts.
How It Functions
- Download: Obtain the pre-prepared Excel file containing Sunyard Technology Co., Ltd's (600571SS) financial metrics.
- Customize: Modify projections such as revenue growth, EBITDA margins, and discount rates.
- Update Automatically: Watch as intrinsic value and NPV calculations refresh in real-time.
- Test Scenarios: Develop various forecasts and instantly analyze different results.
- Make Decisions: Leverage the valuation findings to inform your investment choices.
Why Choose This Calculator?
- Designed for Experts: A sophisticated tool utilized by financial analysts, CFOs, and consultants.
- Accurate Data: Preloaded historical and projected financials for Sunyard Technology Co., Ltd (600571SS) ensure precision.
- Scenario Simulation: Effortlessly model various forecasts and assumptions.
- Defined Outputs: Automatically computes intrinsic value, NPV, and essential metrics.
- User-Friendly: Step-by-step guidance makes the process straightforward.
Who Should Use This Product?
- Individual Investors: Make well-informed decisions regarding the purchase or sale of Sunyard Technology Co.,Ltd (600571SS) stock.
- Financial Analysts: Enhance valuation processes with ready-to-use financial models tailored for Sunyard Technology Co.,Ltd (600571SS).
- Consultants: Provide clients with accurate and timely valuation insights related to Sunyard Technology Co.,Ltd (600571SS).
- Business Owners: Gain insights into how major companies like Sunyard Technology Co.,Ltd (600571SS) are valued to inform your own business strategies.
- Finance Students: Acquire valuable skills in valuation techniques using real-world data from Sunyard Technology Co.,Ltd (600571SS) as a case study.
Overview of the Template's Features
- Pre-Filled Data: Contains Sunyard Technology Co., Ltd's historical financials and projections.
- Discounted Cash Flow Model: An editable DCF valuation model with automatic calculations for ease of use.
- Weighted Average Cost of Capital (WACC): A dedicated worksheet for calculating WACC based on customized inputs.
- Key Financial Ratios: Evaluate Sunyard's profitability, efficiency, and leverage metrics.
- Customizable Inputs: Easily modify revenue growth, margins, and tax rates.
- Clear Dashboard: Visual summaries including charts and tables highlighting important valuation outcomes.
Disclaimer
All information, articles, and product details provided on this website are for general informational and educational purposes only. We do not claim any ownership over, nor do we intend to infringe upon, any trademarks, copyrights, logos, brand names, or other intellectual property mentioned or depicted on this site. Such intellectual property remains the property of its respective owners, and any references here are made solely for identification or informational purposes, without implying any affiliation, endorsement, or partnership.
We make no representations or warranties, express or implied, regarding the accuracy, completeness, or suitability of any content or products presented. Nothing on this website should be construed as legal, tax, investment, financial, medical, or other professional advice. In addition, no part of this site—including articles or product references—constitutes a solicitation, recommendation, endorsement, advertisement, or offer to buy or sell any securities, franchises, or other financial instruments, particularly in jurisdictions where such activity would be unlawful.
All content is of a general nature and may not address the specific circumstances of any individual or entity. It is not a substitute for professional advice or services. Any actions you take based on the information provided here are strictly at your own risk. You accept full responsibility for any decisions or outcomes arising from your use of this website and agree to release us from any liability in connection with your use of, or reliance upon, the content or products found herein.