
|
Shandong Jinjing Science and Technology Stock Co., Ltd. (600586.SS) Valation DCF |
Entièrement Modifiable: Adapté À Vos Besoins Dans Excel Ou Sheets
Conception Professionnelle: Modèles Fiables Et Conformes Aux Normes Du Secteur
Pré-Construits Pour Une Utilisation Rapide Et Efficace
Compatible MAC/PC, entièrement débloqué
Aucune Expertise N'Est Requise; Facile À Suivre
Shandong Jinjing Science and Technology Stock Co., Ltd. (600586.SS) Bundle
Découvrez le véritable potentiel de Shandong Jinjing Science and Technology Stock Co., Ltd. (600586SS) avec notre calculatrice avancée DCF! Ajustez les hypothèses critiques, explorez divers scénarios et évaluez comment les différents changements affectent l'évaluation de Shandong Jinjing Science and Technology Stock Co., Ltd. (600586SS) - le tout dans un modèle Excel complet.
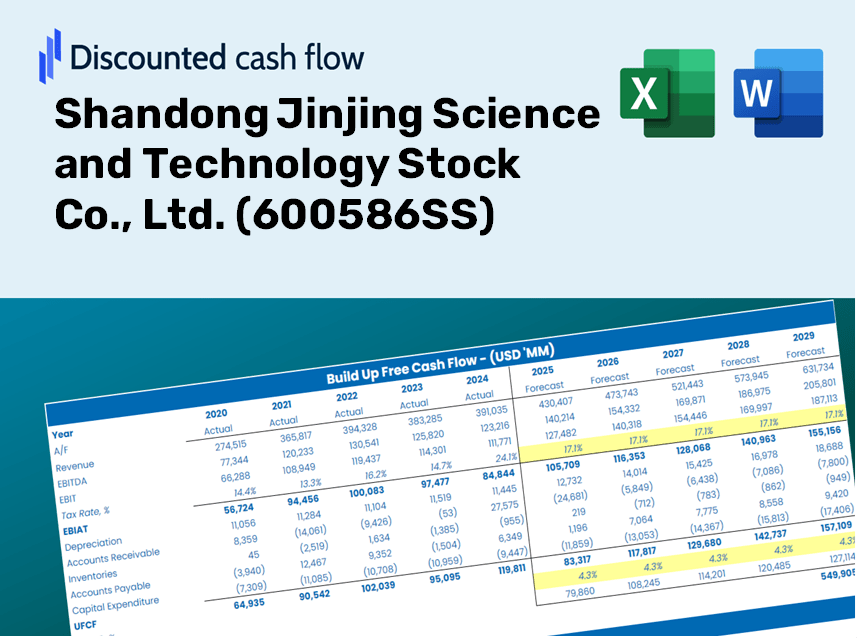
Discounted Cash Flow (DCF) - (USD MM)
| Year | AY1 2020 |
AY2 2021 |
AY3 2022 |
AY4 2023 |
AY5 2024 |
FY1 2025 |
FY2 2026 |
FY3 2027 |
FY4 2028 |
FY5 2029 |
|---|---|---|---|---|---|---|---|---|---|---|
| Revenue | 4,884.0 | 6,921.5 | 7,458.6 | 7,969.7 | 6,452.1 | 7,053.6 | 7,711.1 | 8,429.9 | 9,215.7 | 10,074.8 |
| Revenue Growth, % | 0 | 41.72 | 7.76 | 6.85 | -19.04 | 9.32 | 9.32 | 9.32 | 9.32 | 9.32 |
| EBITDA | 700.7 | 2,150.6 | 998.2 | 1,159.5 | 784.6 | 1,206.3 | 1,318.8 | 1,441.7 | 1,576.1 | 1,723.0 |
| EBITDA, % | 14.35 | 31.07 | 13.38 | 14.55 | 12.16 | 17.1 | 17.1 | 17.1 | 17.1 | 17.1 |
| Depreciation | 533.0 | 408.1 | 468.4 | 511.2 | 555.5 | 537.7 | 587.8 | 642.6 | 702.5 | 768.0 |
| Depreciation, % | 10.91 | 5.9 | 6.28 | 6.41 | 8.61 | 7.62 | 7.62 | 7.62 | 7.62 | 7.62 |
| EBIT | 167.7 | 1,742.5 | 529.8 | 648.3 | 229.0 | 668.6 | 730.9 | 799.1 | 873.6 | 955.0 |
| EBIT, % | 3.43 | 25.17 | 7.1 | 8.13 | 3.55 | 9.48 | 9.48 | 9.48 | 9.48 | 9.48 |
| Total Cash | 1,508.7 | 1,722.4 | 2,185.9 | 1,971.4 | 1,707.8 | 1,922.6 | 2,101.8 | 2,297.8 | 2,512.0 | 2,746.1 |
| Total Cash, percent | .0 | .0 | .0 | .0 | .0 | .0 | .0 | .0 | .0 | .0 |
| Account Receivables | 957.0 | 519.5 | 437.5 | 1,017.8 | 669.6 | 791.6 | 865.4 | 946.1 | 1,034.3 | 1,130.7 |
| Account Receivables, % | 19.59 | 7.51 | 5.87 | 12.77 | 10.38 | 11.22 | 11.22 | 11.22 | 11.22 | 11.22 |
| Inventories | 634.3 | 1,234.3 | 1,370.4 | 878.4 | 925.6 | 1,051.8 | 1,149.9 | 1,257.1 | 1,374.3 | 1,502.4 |
| Inventories, % | 12.99 | 17.83 | 18.37 | 11.02 | 14.35 | 14.91 | 14.91 | 14.91 | 14.91 | 14.91 |
| Accounts Payable | 2,622.3 | 2,640.9 | 3,402.0 | 2,404.3 | 1,870.6 | 2,773.7 | 3,032.3 | 3,315.0 | 3,624.0 | 3,961.8 |
| Accounts Payable, % | 53.69 | 38.15 | 45.61 | 30.17 | 28.99 | 39.32 | 39.32 | 39.32 | 39.32 | 39.32 |
| Capital Expenditure | -416.7 | -592.8 | -458.0 | -410.7 | -343.5 | -475.6 | -520.0 | -568.4 | -621.4 | -679.3 |
| Capital Expenditure, % | -8.53 | -8.56 | -6.14 | -5.15 | -5.32 | -6.74 | -6.74 | -6.74 | -6.74 | -6.74 |
| Tax Rate, % | 44.11 | 44.11 | 44.11 | 44.11 | 44.11 | 44.11 | 44.11 | 44.11 | 44.11 | 44.11 |
| EBITAT | 134.8 | 1,406.3 | 476.7 | 572.7 | 128.0 | 528.6 | 577.9 | 631.7 | 690.6 | 755.0 |
| Depreciation | ||||||||||
| Changes in Account Receivables | ||||||||||
| Changes in Inventories | ||||||||||
| Changes in Accounts Payable | ||||||||||
| Capital Expenditure | ||||||||||
| UFCF | 1,282.0 | 1,077.8 | 1,194.2 | -412.7 | 107.2 | 1,245.6 | 732.5 | 800.7 | 875.4 | 957.0 |
| WACC, % | 9.25 | 9.25 | 9.38 | 9.36 | 8.91 | 9.23 | 9.23 | 9.23 | 9.23 | 9.23 |
| PV UFCF | ||||||||||
| SUM PV UFCF | 3,599.0 | |||||||||
| Long Term Growth Rate, % | 3.00 | |||||||||
| Free cash flow (T + 1) | 986 | |||||||||
| Terminal Value | 15,820 | |||||||||
| Present Terminal Value | 10,174 | |||||||||
| Enterprise Value | 13,772 | |||||||||
| Net Debt | 40 | |||||||||
| Equity Value | 13,733 | |||||||||
| Diluted Shares Outstanding, MM | 1,512 | |||||||||
| Equity Value Per Share | 9.08 |
Benefits You Will Receive
- Adjustable Forecast Parameters: Seamlessly modify assumptions (growth %, margins, WACC) to explore various scenarios.
- Precise Financial Data: Shandong Jinjing’s financial metrics pre-loaded to facilitate your analysis.
- Automated DCF Calculations: The template computes Net Present Value (NPV) and intrinsic value automatically for your convenience.
- Tailored and Professional Design: A refined Excel model that aligns with your valuation requirements.
- Crafted for Analysts and Investors: Perfect for evaluating projections, confirming strategies, and enhancing efficiency.
Key Features
- Accurate Financial Data for Shandong Jinjing: Access reliable pre-loaded historical metrics and future forecasts for (600586SS).
- Flexible Projection Inputs: Modify the yellow-highlighted fields such as WACC, growth rates, and margins to fit your analysis.
- Automated Calculations: Enjoy seamless updates to DCF, Net Present Value (NPV), and cash flow evaluations.
- Interactive Reporting Dashboard: Utilize user-friendly graphs and summaries to clearly present your valuation findings.
- Designed for All Users: An intuitive layout suitable for investors, CFOs, and consultants, whether you're a novice or an expert.
How It Works
- Download the Template: Gain immediate access to the Excel-based SJT DCF Calculator for Shandong Jinjing Science and Technology Stock Co., Ltd. (600586SS).
- Input Your Assumptions: Modify the yellow-highlighted cells to set growth rates, WACC, margins, and other variables.
- Instant Calculations: The model automatically recalculates the intrinsic value of Shandong Jinjing (600586SS).
- Test Scenarios: Experiment with various assumptions to assess how they impact the valuation.
- Analyze and Decide: Utilize the findings to inform your investment strategies or financial evaluations.
Why Choose This Calculator for Shandong Jinjing Science and Technology Stock Co., Ltd. (600586SS)?
- User-Friendly Interface: Suitable for both novices and experienced users.
- Customizable Inputs: Easily adjust parameters to tailor your financial analysis.
- Real-Time Updates: Instantly view changes in Shandong Jinjing’s valuation as you modify the inputs.
- Preloaded Financials: Comes equipped with Shandong Jinjing’s actual financial data for immediate analysis.
- Widely Recognized: Trusted by analysts and investors for making well-informed decisions.
Who Should Utilize This Product?
- Finance Students: Master valuation methods and apply them using real-world data.
- Academics: Integrate industry-specific models into your teaching or research projects.
- Investors: Validate your own assumptions and evaluate valuation results for Shandong Jinjing Science and Technology Stock Co., Ltd. (600586SS).
- Analysts: Enhance your efficiency with a ready-to-use, customizable DCF model.
- Small Business Owners: Acquire knowledge on how major public companies like Shandong Jinjing are assessed.
Contents of the Template
- Pre-Filled Data: Contains Shandong Jinjing Science and Technology Stock Co., Ltd.'s historical financial performance and forecasts.
- Discounted Cash Flow Model: An editable DCF valuation model with automated calculations.
- Weighted Average Cost of Capital (WACC): A specific sheet for computing WACC using customized inputs.
- Key Financial Ratios: Assess Shandong Jinjing's profitability, efficiency, and leverage metrics.
- Customizable Inputs: Easily modify revenue growth, profit margins, and tax rates.
- Clear Dashboard: Visual representations and tables summarizing essential valuation outcomes.
Disclaimer
All information, articles, and product details provided on this website are for general informational and educational purposes only. We do not claim any ownership over, nor do we intend to infringe upon, any trademarks, copyrights, logos, brand names, or other intellectual property mentioned or depicted on this site. Such intellectual property remains the property of its respective owners, and any references here are made solely for identification or informational purposes, without implying any affiliation, endorsement, or partnership.
We make no representations or warranties, express or implied, regarding the accuracy, completeness, or suitability of any content or products presented. Nothing on this website should be construed as legal, tax, investment, financial, medical, or other professional advice. In addition, no part of this site—including articles or product references—constitutes a solicitation, recommendation, endorsement, advertisement, or offer to buy or sell any securities, franchises, or other financial instruments, particularly in jurisdictions where such activity would be unlawful.
All content is of a general nature and may not address the specific circumstances of any individual or entity. It is not a substitute for professional advice or services. Any actions you take based on the information provided here are strictly at your own risk. You accept full responsibility for any decisions or outcomes arising from your use of this website and agree to release us from any liability in connection with your use of, or reliance upon, the content or products found herein.