
|
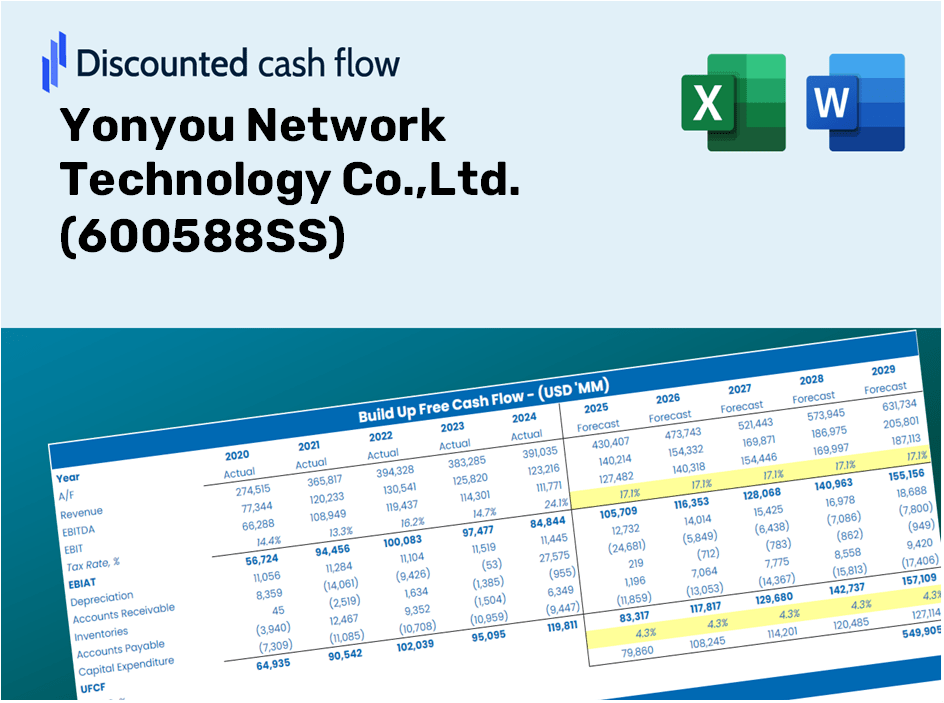
Yonyou Network Technology Co., Ltd. (600588.SS) Évaluation DCF |
Entièrement Modifiable: Adapté À Vos Besoins Dans Excel Ou Sheets
Conception Professionnelle: Modèles Fiables Et Conformes Aux Normes Du Secteur
Pré-Construits Pour Une Utilisation Rapide Et Efficace
Compatible MAC/PC, entièrement débloqué
Aucune Expertise N'Est Requise; Facile À Suivre
Yonyou Network Technology Co.,Ltd. (600588.SS) Bundle
Améliorez vos stratégies d'investissement avec la calculatrice DCF de Yonyou Network Technology Co., Ltd. (600588SS)! Utiliser de réelles données financières, ajuster les prévisions et les dépenses de croissance et observer instantanément comment ces modifications affectent la valeur intrinsèque de Yonyou Network Technology Co., Ltd. (600588SS).
Discounted Cash Flow (DCF) - (USD MM)
| Year | AY1 2020 |
AY2 2021 |
AY3 2022 |
AY4 2023 |
AY5 2024 |
FY1 2025 |
FY2 2026 |
FY3 2027 |
FY4 2028 |
FY5 2029 |
|---|---|---|---|---|---|---|---|---|---|---|
| Revenue | 8,528.4 | 8,931.8 | 9,261.7 | 9,796.1 | 9,152.7 | 9,327.2 | 9,505.0 | 9,686.2 | 9,870.9 | 10,059.1 |
| Revenue Growth, % | 0 | 4.73 | 3.69 | 5.77 | -6.57 | 1.91 | 1.91 | 1.91 | 1.91 | 1.91 |
| EBITDA | 1,513.7 | 1,103.0 | 651.5 | -197.5 | -1,572.0 | 334.7 | 341.0 | 347.6 | 354.2 | 360.9 |
| EBITDA, % | 17.75 | 12.35 | 7.03 | -2.02 | -17.18 | 3.59 | 3.59 | 3.59 | 3.59 | 3.59 |
| Depreciation | 334.9 | 456.2 | 564.3 | 838.1 | 184.6 | 479.4 | 488.5 | 497.9 | 507.4 | 517.0 |
| Depreciation, % | 3.93 | 5.11 | 6.09 | 8.56 | 2.02 | 5.14 | 5.14 | 5.14 | 5.14 | 5.14 |
| EBIT | 1,178.8 | 646.8 | 87.3 | -1,035.7 | -1,756.6 | -144.7 | -147.5 | -150.3 | -153.2 | -156.1 |
| EBIT, % | 13.82 | 7.24 | 0.9424 | -10.57 | -19.19 | -1.55 | -1.55 | -1.55 | -1.55 | -1.55 |
| Total Cash | 5,835.3 | 4,897.4 | 8,342.0 | 8,296.7 | 6,550.9 | 6,894.5 | 7,025.9 | 7,159.9 | 7,296.4 | 7,435.4 |
| Total Cash, percent | .0 | .0 | .0 | .0 | .0 | .0 | .0 | .0 | .0 | .0 |
| Account Receivables | -13.5 | 2,096.0 | 3,203.5 | 3,772.0 | 3,695.7 | 2,551.6 | 2,600.2 | 2,649.8 | 2,700.3 | 2,751.8 |
| Account Receivables, % | -0.1583 | 23.47 | 34.59 | 38.51 | 40.38 | 27.36 | 27.36 | 27.36 | 27.36 | 27.36 |
| Inventories | 423.3 | 407.0 | 530.8 | 551.6 | 410.9 | 473.3 | 482.3 | 491.5 | 500.9 | 510.4 |
| Inventories, % | 4.96 | 4.56 | 5.73 | 5.63 | 4.49 | 5.07 | 5.07 | 5.07 | 5.07 | 5.07 |
| Accounts Payable | 552.0 | 654.3 | 831.8 | 1,006.5 | 1,102.9 | 841.4 | 857.4 | 873.8 | 890.4 | 907.4 |
| Accounts Payable, % | 6.47 | 7.33 | 8.98 | 10.27 | 12.05 | 9.02 | 9.02 | 9.02 | 9.02 | 9.02 |
| Capital Expenditure | -591.5 | -1,029.7 | -1,556.7 | -1,796.9 | -1,759.0 | -1,358.7 | -1,384.6 | -1,411.0 | -1,437.9 | -1,465.3 |
| Capital Expenditure, % | -6.94 | -11.53 | -16.81 | -18.34 | -19.22 | -14.57 | -14.57 | -14.57 | -14.57 | -14.57 |
| Tax Rate, % | 0.71957 | 0.71957 | 0.71957 | 0.71957 | 0.71957 | 0.71957 | 0.71957 | 0.71957 | 0.71957 | 0.71957 |
| EBITAT | 1,034.4 | 591.4 | 77.5 | -1,100.7 | -1,744.0 | -135.3 | -137.8 | -140.5 | -143.2 | -145.9 |
| Depreciation | ||||||||||
| Changes in Account Receivables | ||||||||||
| Changes in Inventories | ||||||||||
| Changes in Accounts Payable | ||||||||||
| Capital Expenditure | ||||||||||
| UFCF | 919.9 | -1,972.9 | -1,968.8 | -2,474.0 | -3,005.0 | -194.3 | -1,075.5 | -1,096.0 | -1,116.9 | -1,138.2 |
| WACC, % | 5.21 | 5.22 | 5.21 | 5.25 | 5.25 | 5.23 | 5.23 | 5.23 | 5.23 | 5.23 |
| PV UFCF | ||||||||||
| SUM PV UFCF | -3,889.6 | |||||||||
| Long Term Growth Rate, % | 4.00 | |||||||||
| Free cash flow (T + 1) | -1,184 | |||||||||
| Terminal Value | -96,369 | |||||||||
| Present Terminal Value | -74,692 | |||||||||
| Enterprise Value | -78,582 | |||||||||
| Net Debt | -582 | |||||||||
| Equity Value | -78,000 | |||||||||
| Diluted Shares Outstanding, MM | 3,325 | |||||||||
| Equity Value Per Share | -23.46 |
What You Will Receive
- Genuine Yonyou Data: Preloaded financial metrics – including revenue and EBIT – derived from actual and projected results.
- Complete Customization: Modify all essential parameters (yellow cells) such as WACC, growth percentage, and tax rates.
- Instant Valuation Updates: Automatic recalculations to assess the effect of changes on Yonyou’s intrinsic value.
- Flexible Excel Template: Designed for easy modifications, scenario analyses, and comprehensive projections.
- Efficient and Precise: Eliminate the need to build models from the ground up while ensuring accuracy and adaptability.
Key Features
- Customizable Forecast Inputs: Adjust key metrics such as revenue growth, EBITDA %, and capital expenditures tailored for Yonyou Network Technology Co., Ltd. (600588SS).
- Instant DCF Valuation: Automatically computes intrinsic value, NPV, and other financial metrics with ease.
- High Precision Accuracy: Leverages Yonyou's real financial data to deliver realistic and reliable valuation results.
- Simplified Scenario Analysis: Effortlessly evaluate various assumptions and analyze different outcomes.
- Efficiency-Boosting Tool: Streamline your valuation processes and avoid the hassle of constructing complex models from scratch.
How It Works
- Step 1: Download the Excel file.
- Step 2: Examine Yonyou Network Technology Co., Ltd.'s pre-filled financial data and forecasts.
- Step 3: Adjust key inputs such as revenue growth, WACC, and tax rates (highlighted cells).
- Step 4: Observe the DCF model update in real-time as you modify your assumptions.
- Step 5: Review the output and leverage the findings for your investment strategies.
Why Utilize This Calculator for Yonyou Network Technology Co., Ltd.?
- Precise Data: Authentic financial figures for Yonyou (600588SS) guarantee trustworthy valuation outcomes.
- Flexible: Modify essential variables such as growth rates, WACC, and tax rates to align with your forecasts.
- Time-Efficient: Ready-made calculations save you the effort of building from the ground up.
- Professional-Quality Tool: Tailored for investors, analysts, and consultants in the technology sector.
- User-Friendly Design: Clear layout and comprehensive instructions ensure accessibility for all users.
Who Is This Product For?
- Individual Investors: Gain valuable insights for making informed decisions on buying or selling Yonyou Network Technology Co., Ltd. (600588SS) stock.
- Financial Analysts: Enhance your valuation processes with efficient, ready-to-use financial models tailored for Yonyou Network Technology Co., Ltd. (600588SS).
- Consultants: Provide clients with precise and timely valuation insights regarding Yonyou Network Technology Co., Ltd. (600588SS).
- Business Owners: Learn how prominent firms like Yonyou Network Technology Co., Ltd. (600588SS) are valued to inform your own business strategies.
- Finance Students: Explore real-world data and situations to master valuation techniques relevant to Yonyou Network Technology Co., Ltd. (600588SS).
Contents of the Template
- Operating and Balance Sheet Data: Pre-filled historical data and forecasts for Yonyou Network Technology Co., Ltd. (600588SS), including revenue, EBITDA, EBIT, and capital expenditures.
- WACC Calculation: A dedicated sheet for calculating the Weighted Average Cost of Capital (WACC), featuring parameters such as Beta, risk-free rate, and share price.
- DCF Valuation (Unlevered and Levered): Customizable Discounted Cash Flow models that provide intrinsic value calculations in detail.
- Financial Statements: Pre-loaded annual and quarterly financial statements to aid in analysis.
- Key Ratios: A collection of profitability, leverage, and efficiency ratios for Yonyou Network Technology Co., Ltd. (600588SS).
- Dashboard and Charts: A visual overview of valuation outcomes and underlying assumptions for easy results analysis.
Disclaimer
All information, articles, and product details provided on this website are for general informational and educational purposes only. We do not claim any ownership over, nor do we intend to infringe upon, any trademarks, copyrights, logos, brand names, or other intellectual property mentioned or depicted on this site. Such intellectual property remains the property of its respective owners, and any references here are made solely for identification or informational purposes, without implying any affiliation, endorsement, or partnership.
We make no representations or warranties, express or implied, regarding the accuracy, completeness, or suitability of any content or products presented. Nothing on this website should be construed as legal, tax, investment, financial, medical, or other professional advice. In addition, no part of this site—including articles or product references—constitutes a solicitation, recommendation, endorsement, advertisement, or offer to buy or sell any securities, franchises, or other financial instruments, particularly in jurisdictions where such activity would be unlawful.
All content is of a general nature and may not address the specific circumstances of any individual or entity. It is not a substitute for professional advice or services. Any actions you take based on the information provided here are strictly at your own risk. You accept full responsibility for any decisions or outcomes arising from your use of this website and agree to release us from any liability in connection with your use of, or reliance upon, the content or products found herein.