
|
Miura Co., Ltd. (6005.T) Évaluation DCF |
Entièrement Modifiable: Adapté À Vos Besoins Dans Excel Ou Sheets
Conception Professionnelle: Modèles Fiables Et Conformes Aux Normes Du Secteur
Pré-Construits Pour Une Utilisation Rapide Et Efficace
Compatible MAC/PC, entièrement débloqué
Aucune Expertise N'Est Requise; Facile À Suivre
Miura Co., Ltd. (6005.T) Bundle
Découvrez la vraie valeur de Miura Co., Ltd. (6005T) avec notre calculatrice DCF de qualité professionnelle! Ajustez les hypothèses clés, explorez divers scénarios et évaluez comment les différents facteurs influencent la valorisation de Miura Co., Ltd. (6005T) - le tout dans un seul modèle Excel.
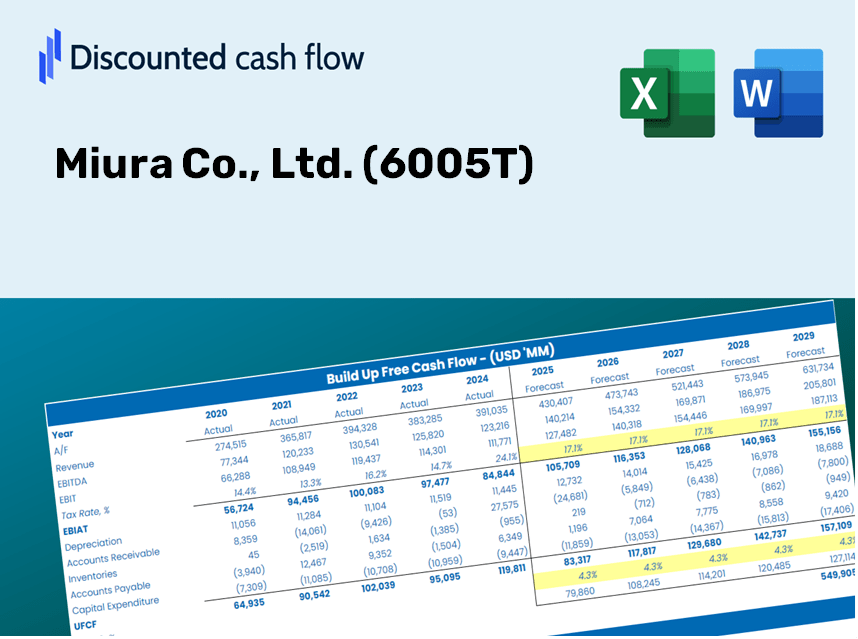
Discounted Cash Flow (DCF) - (USD MM)
| Year | AY1 2021 |
AY2 2022 |
AY3 2023 |
AY4 2024 |
AY5 2025 |
FY1 2026 |
FY2 2027 |
FY3 2028 |
FY4 2029 |
FY5 2030 |
|---|---|---|---|---|---|---|---|---|---|---|
| Revenue | 134,732.0 | 143,543.0 | 158,377.0 | 159,695.0 | 251,341.0 | 298,526.6 | 354,570.6 | 421,136.1 | 500,198.3 | 594,103.2 |
| Revenue Growth, % | 0 | 6.54 | 10.33 | 0.83219 | 57.39 | 18.77 | 18.77 | 18.77 | 18.77 | 18.77 |
| EBITDA | 24,982.0 | 26,927.0 | 29,352.0 | 30,774.0 | 41,090.0 | 54,602.1 | 64,852.8 | 77,028.0 | 91,488.9 | 108,664.6 |
| EBITDA, % | 18.54 | 18.76 | 18.53 | 19.27 | 16.35 | 18.29 | 18.29 | 18.29 | 18.29 | 18.29 |
| Depreciation | 6,733.0 | 6,879.0 | 7,033.0 | 6,707.0 | 14,406.0 | 14,425.9 | 17,134.1 | 20,350.8 | 24,171.4 | 28,709.2 |
| Depreciation, % | 5 | 4.79 | 4.44 | 4.2 | 5.73 | 4.83 | 4.83 | 4.83 | 4.83 | 4.83 |
| EBIT | 18,249.0 | 20,048.0 | 22,319.0 | 24,067.0 | 26,684.0 | 40,176.2 | 47,718.7 | 56,677.2 | 67,317.5 | 79,955.4 |
| EBIT, % | 13.54 | 13.97 | 14.09 | 15.07 | 10.62 | 13.46 | 13.46 | 13.46 | 13.46 | 13.46 |
| Total Cash | 57,856.0 | 57,915.0 | 53,734.0 | 57,798.0 | 55,251.0 | 104,718.0 | 124,377.3 | 147,727.4 | 175,461.0 | 208,401.3 |
| Total Cash, percent | .0 | .0 | .0 | .0 | .0 | .0 | .0 | .0 | .0 | .0 |
| Account Receivables | 38,628.0 | 42,681.0 | 41,575.0 | 47,934.0 | 71,061.0 | 85,344.9 | 101,367.2 | 120,397.4 | 143,000.2 | 169,846.5 |
| Account Receivables, % | 28.67 | 29.73 | 26.25 | 30.02 | 28.27 | 28.59 | 28.59 | 28.59 | 28.59 | 28.59 |
| Inventories | 19,664.0 | 23,436.0 | 26,891.0 | 30,087.0 | 39,573.0 | 49,248.4 | 58,494.1 | 69,475.5 | 82,518.6 | 98,010.2 |
| Inventories, % | 14.59 | 16.33 | 16.98 | 18.84 | 15.74 | 16.5 | 16.5 | 16.5 | 16.5 | 16.5 |
| Accounts Payable | 13,915.0 | 15,916.0 | 6,116.0 | 6,994.0 | 23,804.0 | 23,361.5 | 27,747.2 | 32,956.4 | 39,143.5 | 46,492.1 |
| Accounts Payable, % | 10.33 | 11.09 | 3.86 | 4.38 | 9.47 | 7.83 | 7.83 | 7.83 | 7.83 | 7.83 |
| Capital Expenditure | -3,516.0 | -4,353.0 | -2,658.0 | -2,972.0 | -6,125.0 | -6,936.8 | -8,239.1 | -9,785.9 | -11,623.0 | -13,805.1 |
| Capital Expenditure, % | -2.61 | -3.03 | -1.68 | -1.86 | -2.44 | -2.32 | -2.32 | -2.32 | -2.32 | -2.32 |
| Tax Rate, % | 6.44 | 6.44 | 6.44 | 6.44 | 6.44 | 6.44 | 6.44 | 6.44 | 6.44 | 6.44 |
| EBITAT | 12,753.7 | 14,099.6 | 16,050.4 | 17,400.0 | 24,965.2 | 30,372.1 | 36,074.1 | 42,846.4 | 50,890.2 | 60,444.1 |
| Depreciation | ||||||||||
| Changes in Account Receivables | ||||||||||
| Changes in Inventories | ||||||||||
| Changes in Accounts Payable | ||||||||||
| Capital Expenditure | ||||||||||
| UFCF | -28,406.3 | 10,801.6 | 8,276.4 | 12,458.0 | 17,443.2 | 13,459.3 | 24,086.9 | 28,608.9 | 33,979.8 | 40,359.0 |
| WACC, % | 6.85 | 6.85 | 6.86 | 6.86 | 6.97 | 6.88 | 6.88 | 6.88 | 6.88 | 6.88 |
| PV UFCF | ||||||||||
| SUM PV UFCF | 112,087.0 | |||||||||
| Long Term Growth Rate, % | 2.00 | |||||||||
| Free cash flow (T + 1) | 41,166 | |||||||||
| Terminal Value | 843,528 | |||||||||
| Present Terminal Value | 604,801 | |||||||||
| Enterprise Value | 716,888 | |||||||||
| Net Debt | -34,055 | |||||||||
| Equity Value | 750,943 | |||||||||
| Diluted Shares Outstanding, MM | 113 | |||||||||
| Equity Value Per Share | 6,644.04 |
What You Will Receive
- Customizable Excel Template: An Excel-based DCF Calculator tailored for Miura Co., Ltd. (6005T) with populated financial data.
- Actual Market Data: Historical performance metrics and future projections (highlighted in the yellow cells).
- Adjustable Forecasting: Modify key assumptions such as revenue growth, EBITDA percentage, and WACC.
- Real-Time Calculations: Quickly observe how your inputs affect the valuation of Miura Co., Ltd. (6005T).
- Professional Resource: Designed for investors, CFOs, consultants, and financial analysts.
- Intuitive Layout: Organized for straightforward navigation and usability, accompanied by step-by-step guidance.
Key Features of Miura Co., Ltd. (6005T)
- Authentic Financial Data: Gain access to accurate historical data and future forecasts tailored for Miura Co., Ltd. (6005T).
- Customizable Projection Parameters: Easily modify highlighted cells for WACC, growth rates, and profit margins.
- Automatic Calculations: Real-time updates for DCF, Net Present Value (NPV), and cash flow assessments.
- User-Friendly Dashboard: Intuitive charts and summaries to clearly present your valuation insights.
- Designed for All Experience Levels: An accessible framework suited for investors, CFOs, and consultants alike.
How It Works
- Step 1: Download the prebuilt Excel template containing Miura Co., Ltd.'s data.
- Step 2: Review the pre-filled sheets to familiarize yourself with the essential metrics.
- Step 3: Adjust forecasts and assumptions in the editable yellow cells (WACC, growth, margins).
- Step 4: Instantly view the recalculated results, including Miura Co., Ltd.'s intrinsic value.
- Step 5: Use the outputs to make informed investment decisions or generate reports.
Why Choose Miura Co., Ltd. (6005T)?
- User-Friendly Design: Perfect for both newcomers and seasoned professionals.
- Customizable Inputs: Adjust parameters effortlessly to suit your evaluations.
- Real-Time Feedback: Observe immediate changes to Miura Co., Ltd. (6005T)'s figures as you modify inputs.
- Pre-Loaded Data: Comes equipped with Miura Co., Ltd. (6005T)'s actual financial information for swift assessments.
- Endorsed by Experts: Utilized by analysts and investors for making well-informed choices.
Who Can Benefit from Miura Co., Ltd. (6005T)?
- Investors: Assess Miura's valuation prior to making stock trading decisions.
- CFOs and Financial Analysts: Optimize valuation methodologies and evaluate forecasts.
- Startup Founders: Discover how established firms like Miura are assessed for value.
- Consultants: Create comprehensive valuation reports for your clientele.
- Students and Educators: Utilize actual market data to practice and teach valuation strategies.
Contents of the Template
- Preloaded Miura Co., Ltd. Data: Historical and projected financial metrics, including revenue, EBIT, and capital expenditures.
- DCF and WACC Models: Advanced spreadsheets for calculating intrinsic value and Weighted Average Cost of Capital.
- Editable Inputs: Yellow-highlighted fields for modifying revenue growth assumptions, tax rates, and discount rates.
- Financial Statements: Detailed annual and quarterly financial reports for thorough analysis.
- Key Ratios: Indicators of profitability, leverage, and efficiency to assess company performance.
- Dashboard and Charts: Visual representations of valuation results and underlying assumptions.
Disclaimer
All information, articles, and product details provided on this website are for general informational and educational purposes only. We do not claim any ownership over, nor do we intend to infringe upon, any trademarks, copyrights, logos, brand names, or other intellectual property mentioned or depicted on this site. Such intellectual property remains the property of its respective owners, and any references here are made solely for identification or informational purposes, without implying any affiliation, endorsement, or partnership.
We make no representations or warranties, express or implied, regarding the accuracy, completeness, or suitability of any content or products presented. Nothing on this website should be construed as legal, tax, investment, financial, medical, or other professional advice. In addition, no part of this site—including articles or product references—constitutes a solicitation, recommendation, endorsement, advertisement, or offer to buy or sell any securities, franchises, or other financial instruments, particularly in jurisdictions where such activity would be unlawful.
All content is of a general nature and may not address the specific circumstances of any individual or entity. It is not a substitute for professional advice or services. Any actions you take based on the information provided here are strictly at your own risk. You accept full responsibility for any decisions or outcomes arising from your use of this website and agree to release us from any liability in connection with your use of, or reliance upon, the content or products found herein.