
|
Founder Technology Group Co., Ltd. (600601.SS) Évaluation DCF |
Entièrement Modifiable: Adapté À Vos Besoins Dans Excel Ou Sheets
Conception Professionnelle: Modèles Fiables Et Conformes Aux Normes Du Secteur
Pré-Construits Pour Une Utilisation Rapide Et Efficace
Compatible MAC/PC, entièrement débloqué
Aucune Expertise N'Est Requise; Facile À Suivre
Founder Technology Group Co.,Ltd. (600601.SS) Bundle
Rationalisez votre analyse et améliorez la précision avec notre calculatrice DCF (600601SS)! En utilisant des données réelles de Founder Technology Group Co., Ltd. et des hypothèses personnalisables, cet outil vous permet de prévoir, d'analyser et de valeur (600601SS) comme un investisseur chevronné.
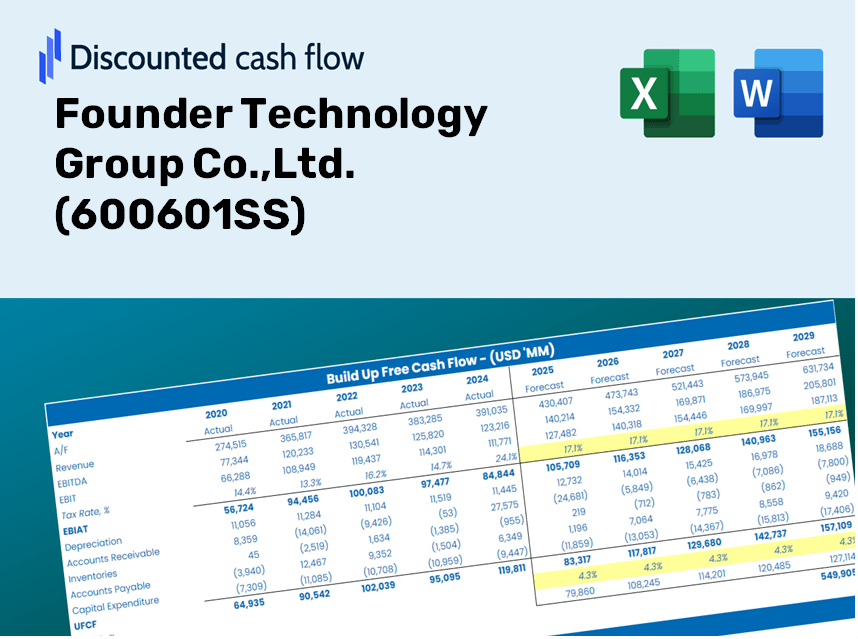
Discounted Cash Flow (DCF) - (USD MM)
| Year | AY1 2020 |
AY2 2021 |
AY3 2022 |
AY4 2023 |
AY5 2024 |
FY1 2025 |
FY2 2026 |
FY3 2027 |
FY4 2028 |
FY5 2029 |
|---|---|---|---|---|---|---|---|---|---|---|
| Revenue | 5,972.5 | 5,431.6 | 4,888.7 | 3,148.9 | 3,481.7 | 3,098.0 | 2,756.7 | 2,452.9 | 2,182.7 | 1,942.2 |
| Revenue Growth, % | 0 | -9.06 | -10 | -35.59 | 10.57 | -11.02 | -11.02 | -11.02 | -11.02 | -11.02 |
| EBITDA | 317.6 | -61.4 | 118.6 | 349.9 | 466.8 | 192.9 | 171.6 | 152.7 | 135.9 | 120.9 |
| EBITDA, % | 5.32 | -1.13 | 2.43 | 11.11 | 13.41 | 6.23 | 6.23 | 6.23 | 6.23 | 6.23 |
| Depreciation | 217.5 | 322.0 | 346.1 | 193.3 | 203.0 | 177.3 | 157.8 | 140.4 | 124.9 | 111.2 |
| Depreciation, % | 3.64 | 5.93 | 7.08 | 6.14 | 5.83 | 5.72 | 5.72 | 5.72 | 5.72 | 5.72 |
| EBIT | 100.1 | -383.4 | -227.5 | 156.6 | 263.8 | 15.6 | 13.9 | 12.3 | 11.0 | 9.8 |
| EBIT, % | 1.68 | -7.06 | -4.65 | 4.97 | 7.58 | 0.5026 | 0.5026 | 0.5026 | 0.5026 | 0.5026 |
| Total Cash | 953.4 | 638.6 | 944.2 | 924.3 | 1,331.1 | 710.2 | 631.9 | 562.3 | 500.3 | 445.2 |
| Total Cash, percent | .0 | .0 | .0 | .0 | .0 | .0 | .0 | .0 | .0 | .0 |
| Account Receivables | 1,794.2 | 1,756.5 | 739.0 | 915.5 | 1,122.8 | 860.1 | 765.4 | 681.0 | 606.0 | 539.2 |
| Account Receivables, % | 30.04 | 32.34 | 15.12 | 29.07 | 32.25 | 27.76 | 27.76 | 27.76 | 27.76 | 27.76 |
| Inventories | 1,345.9 | 1,311.5 | 506.1 | 429.4 | 605.9 | 545.7 | 485.6 | 432.1 | 384.5 | 342.1 |
| Inventories, % | 22.54 | 24.15 | 10.35 | 13.64 | 17.4 | 17.61 | 17.61 | 17.61 | 17.61 | 17.61 |
| Accounts Payable | 2,509.9 | 2,580.9 | 978.0 | 1,031.4 | 1,398.4 | 1,130.6 | 1,006.0 | 895.2 | 796.5 | 708.8 |
| Accounts Payable, % | 42.02 | 47.52 | 20.01 | 32.75 | 40.17 | 36.49 | 36.49 | 36.49 | 36.49 | 36.49 |
| Capital Expenditure | -721.3 | -320.4 | -403.2 | -693.9 | -1,113.7 | -497.2 | -442.4 | -393.7 | -350.3 | -311.7 |
| Capital Expenditure, % | -12.08 | -5.9 | -8.25 | -22.04 | -31.99 | -16.05 | -16.05 | -16.05 | -16.05 | -16.05 |
| Tax Rate, % | 7.35 | 7.35 | 7.35 | 7.35 | 7.35 | 7.35 | 7.35 | 7.35 | 7.35 | 7.35 |
| EBITAT | 107.1 | -378.8 | -225.7 | 144.1 | 244.4 | 15.0 | 13.4 | 11.9 | 10.6 | 9.4 |
| Depreciation | ||||||||||
| Changes in Account Receivables | ||||||||||
| Changes in Inventories | ||||||||||
| Changes in Accounts Payable | ||||||||||
| Capital Expenditure | ||||||||||
| UFCF | -1,026.9 | -234.1 | -62.7 | -403.0 | -682.9 | -249.9 | -240.9 | -214.4 | -190.8 | -169.7 |
| WACC, % | 7.43 | 7.43 | 7.43 | 7.43 | 7.43 | 7.43 | 7.43 | 7.43 | 7.43 | 7.43 |
| PV UFCF | ||||||||||
| SUM PV UFCF | -876.1 | |||||||||
| Long Term Growth Rate, % | 4.00 | |||||||||
| Free cash flow (T + 1) | -177 | |||||||||
| Terminal Value | -5,144 | |||||||||
| Present Terminal Value | -3,594 | |||||||||
| Enterprise Value | -4,470 | |||||||||
| Net Debt | -428 | |||||||||
| Equity Value | -4,042 | |||||||||
| Diluted Shares Outstanding, MM | 4,170 | |||||||||
| Equity Value Per Share | -0.97 |
What You Will Receive
- Genuine [Symbol] Financial Data: Pre-loaded with Founder Technology Group Co., Ltd.'s historical and projected figures for accurate analysis.
- Fully Customizable Template: Easily adjust key parameters such as revenue growth, WACC, and EBITDA %.
- Instant Calculations: Watch [Symbol]’s intrinsic value update in real-time as you make changes.
- Professional Valuation Tool: Tailored for investors, analysts, and consultants who demand reliable DCF outcomes.
- User-Centric Design: Streamlined layout and straightforward instructions suitable for all skill levels.
Main Attributes
- Customizable Forecast Inputs: Adjust essential factors such as revenue growth, EBITDA margin, and capital expenditures.
- Instant DCF Valuation: Quickly computes intrinsic value, NPV, and additional financial metrics.
- High-Precision Results: Leverages Founder Technology Group’s actual financial data for accurate valuation insights.
- Effortless Scenario Analysis: Easily evaluate various assumptions and analyze different outcomes.
- Efficiency Booster: Avoid the hassle of crafting intricate valuation models from the ground up.
How It Functions
- Download: Obtain the pre-configured Excel file containing Founder Technology Group Co., Ltd.'s financial data.
- Customize: Modify projections, including revenue growth, EBITDA %, and WACC.
- Automatic Updates: The intrinsic value and NPV calculations refresh in real-time.
- Scenario Testing: Create various projections and instantly compare results.
- Informed Decisions: Leverage the valuation findings to shape your investment strategy for (600601SS).
Why Opt for This Calculator?
- Reliable Data: Authentic Founder Technology Group Co., Ltd. (600601SS) financials guarantee trustworthy valuation outcomes.
- Tailorable: Modify essential parameters like growth rates, WACC, and tax rates to align with your forecasts.
- Efficiency: Pre-designed calculations save you from starting with a blank slate.
- Expert-Level Tool: Crafted for investors, analysts, and consultants in the field.
- Easy to Use: User-friendly design and detailed instructions ensure accessibility for all users.
Who Should Consider Founder Technology Group Co.,Ltd. (600601SS)?
- Individual Investors: Make educated choices regarding the purchase or sale of Founder Technology Group (600601SS) shares.
- Financial Analysts: Enhance valuation workflows with ready-to-apply financial models specific to Founder Technology Group.
- Consultants: Provide clients with timely and precise valuation insights related to Founder Technology Group (600601SS).
- Business Owners: Gain an understanding of how large enterprises like Founder Technology Group (600601SS) are valued to inform your own business strategies.
- Finance Students: Explore valuation techniques using real-life data and case studies from Founder Technology Group (600601SS).
Contents of the Template
- Operating and Balance Sheet Data: Pre-filled historical data and forecasts for Founder Technology Group Co., Ltd. (600601SS), including metrics such as revenue, EBITDA, EBIT, and capital expenditures.
- WACC Calculation: A dedicated sheet for calculating the Weighted Average Cost of Capital (WACC), featuring parameters like Beta, risk-free rate, and share price.
- DCF Valuation (Unlevered and Levered): Customizable Discounted Cash Flow models that present intrinsic value with comprehensive calculations.
- Financial Statements: Pre-loaded financial statements (annual and quarterly) to facilitate thorough analysis.
- Key Ratios: Includes profitability, leverage, and efficiency ratios specific to Founder Technology Group Co., Ltd. (600601SS).
- Dashboard and Charts: Visual summary of valuation outputs and assumptions for easy result analysis.
Disclaimer
All information, articles, and product details provided on this website are for general informational and educational purposes only. We do not claim any ownership over, nor do we intend to infringe upon, any trademarks, copyrights, logos, brand names, or other intellectual property mentioned or depicted on this site. Such intellectual property remains the property of its respective owners, and any references here are made solely for identification or informational purposes, without implying any affiliation, endorsement, or partnership.
We make no representations or warranties, express or implied, regarding the accuracy, completeness, or suitability of any content or products presented. Nothing on this website should be construed as legal, tax, investment, financial, medical, or other professional advice. In addition, no part of this site—including articles or product references—constitutes a solicitation, recommendation, endorsement, advertisement, or offer to buy or sell any securities, franchises, or other financial instruments, particularly in jurisdictions where such activity would be unlawful.
All content is of a general nature and may not address the specific circumstances of any individual or entity. It is not a substitute for professional advice or services. Any actions you take based on the information provided here are strictly at your own risk. You accept full responsibility for any decisions or outcomes arising from your use of this website and agree to release us from any liability in connection with your use of, or reliance upon, the content or products found herein.