
|
Shanghai Huitong Energy Co., Ltd (600605.SS) Évaluation DCF |
Entièrement Modifiable: Adapté À Vos Besoins Dans Excel Ou Sheets
Conception Professionnelle: Modèles Fiables Et Conformes Aux Normes Du Secteur
Pré-Construits Pour Une Utilisation Rapide Et Efficace
Compatible MAC/PC, entièrement débloqué
Aucune Expertise N'Est Requise; Facile À Suivre
Shanghai Huitong Energy Co.,Ltd (600605.SS) Bundle
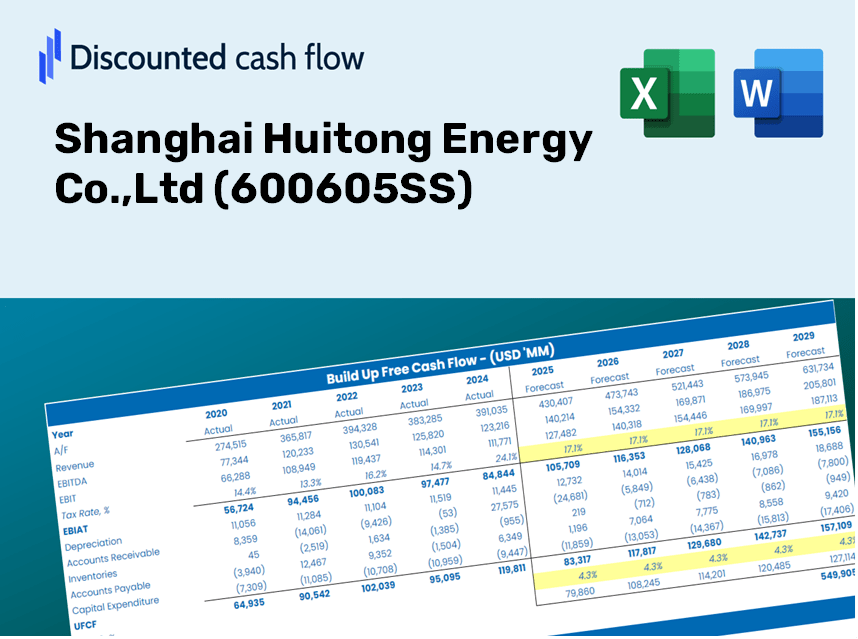
Explorez l'avenir financier de Shanghai Huitong Energy Co., Ltd avec notre calculatrice DCF conviviale! Entrez vos hypothèses de croissance, de marges et de coûts pour déterminer la valeur intrinsèque de Shanghai Huitong Energy Co., Ltd (600605SS) et façonnez votre stratégie d'investissement.
Discounted Cash Flow (DCF) - (USD MM)
| Year | AY1 2020 |
AY2 2021 |
AY3 2022 |
AY4 2023 |
AY5 2024 |
FY1 2025 |
FY2 2026 |
FY3 2027 |
FY4 2028 |
FY5 2029 |
|---|---|---|---|---|---|---|---|---|---|---|
| Revenue | 92.6 | 112.9 | 108.5 | 130.0 | 136.5 | 151.2 | 167.4 | 185.3 | 205.2 | 227.1 |
| Revenue Growth, % | 0 | 21.91 | -3.89 | 19.82 | 5.03 | 10.72 | 10.72 | 10.72 | 10.72 | 10.72 |
| EBITDA | 71.4 | 89.4 | 25.0 | 60.5 | 29.0 | 74.7 | 82.7 | 91.6 | 101.4 | 112.3 |
| EBITDA, % | 77.15 | 79.24 | 23.03 | 46.58 | 21.22 | 49.44 | 49.44 | 49.44 | 49.44 | 49.44 |
| Depreciation | 5.2 | 7.1 | 7.0 | 6.8 | 12.1 | 9.8 | 10.9 | 12.1 | 13.3 | 14.8 |
| Depreciation, % | 5.64 | 6.3 | 6.5 | 5.23 | 8.87 | 6.51 | 6.51 | 6.51 | 6.51 | 6.51 |
| EBIT | 66.2 | 82.3 | 17.9 | 53.7 | 16.9 | 64.9 | 71.9 | 79.6 | 88.1 | 97.5 |
| EBIT, % | 71.51 | 72.94 | 16.54 | 41.34 | 12.35 | 42.94 | 42.94 | 42.94 | 42.94 | 42.94 |
| Total Cash | 33.8 | 379.1 | 401.6 | 1,360.6 | 1,460.1 | 131.9 | 146.1 | 161.7 | 179.1 | 198.3 |
| Total Cash, percent | .0 | .0 | .0 | .0 | .0 | .0 | .0 | .0 | .0 | .0 |
| Account Receivables | 9.5 | 17.6 | 29.9 | 24.5 | 31.9 | 28.9 | 32.0 | 35.4 | 39.2 | 43.4 |
| Account Receivables, % | 10.23 | 15.62 | 27.59 | 18.82 | 23.34 | 19.12 | 19.12 | 19.12 | 19.12 | 19.12 |
| Inventories | 694.4 | 1,466.4 | 1,605.6 | 3.0 | .4 | 91.5 | 101.3 | 112.1 | 124.2 | 137.5 |
| Inventories, % | 749.98 | 1299.16 | 1479.99 | 2.3 | 0.28709 | 60.52 | 60.52 | 60.52 | 60.52 | 60.52 |
| Accounts Payable | 10.9 | 46.3 | 71.3 | 20.1 | 26.0 | 46.3 | 51.2 | 56.7 | 62.8 | 69.5 |
| Accounts Payable, % | 11.77 | 40.98 | 65.75 | 15.45 | 19.05 | 30.6 | 30.6 | 30.6 | 30.6 | 30.6 |
| Capital Expenditure | -3.2 | -3.9 | -.2 | -.1 | -42.8 | -11.6 | -12.9 | -14.3 | -15.8 | -17.5 |
| Capital Expenditure, % | -3.42 | -3.48 | -0.22307 | -0.07846999 | -31.32 | -7.71 | -7.71 | -7.71 | -7.71 | -7.71 |
| Tax Rate, % | 20.62 | 20.62 | 20.62 | 20.62 | 20.62 | 20.62 | 20.62 | 20.62 | 20.62 | 20.62 |
| EBITAT | 49.7 | 65.6 | 9.4 | 57.6 | 13.4 | 50.2 | 55.6 | 61.5 | 68.1 | 75.4 |
| Depreciation | ||||||||||
| Changes in Account Receivables | ||||||||||
| Changes in Inventories | ||||||||||
| Changes in Accounts Payable | ||||||||||
| Capital Expenditure | ||||||||||
| UFCF | -641.2 | -676.1 | -110.1 | 1,621.1 | -16.2 | -19.5 | 45.6 | 50.5 | 55.9 | 61.9 |
| WACC, % | 4.66 | 4.66 | 4.65 | 4.66 | 4.66 | 4.66 | 4.66 | 4.66 | 4.66 | 4.66 |
| PV UFCF | ||||||||||
| SUM PV UFCF | 163.0 | |||||||||
| Long Term Growth Rate, % | 3.80 | |||||||||
| Free cash flow (T + 1) | 64 | |||||||||
| Terminal Value | 7,501 | |||||||||
| Present Terminal Value | 5,974 | |||||||||
| Enterprise Value | 6,137 | |||||||||
| Net Debt | -1,448 | |||||||||
| Equity Value | 7,585 | |||||||||
| Diluted Shares Outstanding, MM | 206 | |||||||||
| Equity Value Per Share | 36.77 |
What You Will Receive
- Comprehensive Financial Model: Leverage Shanghai Huitong Energy's actual data for accurate DCF valuation.
- Complete Forecasting Control: Modify revenue growth, profit margins, WACC, and other critical factors.
- Real-Time Calculations: Automatic updates provide immediate results as you adjust parameters.
- Investor-Ready Template: A polished Excel file crafted for high-quality valuation.
- Customizable and Reusable: Designed for versatility, enabling recurring use for in-depth forecasting.
Key Features
- Real-Time Huitong Energy Data: Pre-loaded with Shanghai Huitong Energy Co., Ltd's historical financials and projections for future performance.
- Comprehensive Customization Options: Modify key variables such as revenue growth, profit margins, WACC, tax rates, and capital expenditures.
- Interactive Valuation Model: Automatically recalculates Net Present Value (NPV) and intrinsic value based on your changes.
- Scenario Analysis: Develop various forecast scenarios to evaluate different valuation results.
- User-Friendly Interface: Intuitive, organized design suitable for both professionals and newcomers.
How It Works
- Step 1: Download the Excel file.
- Step 2: Examine Shanghai Huitong Energy Co., Ltd's pre-filled financial data and projections.
- Step 3: Adjust key inputs such as revenue growth, WACC, and tax rates (highlighted cells).
- Step 4: Observe the DCF model update in real-time as you modify your assumptions.
- Step 5: Review the outputs and leverage the results for informed investment choices.
Why Opt for This Calculator?
- User-Friendly Design: Suitable for both novices and seasoned professionals.
- Customizable Inputs: Adjust parameters effortlessly to suit your analysis needs.
- Real-Time Feedback: Observe immediate updates to Shanghai Huitong Energy Co., Ltd’s valuation as you modify inputs.
- Preloaded Data: Comes equipped with Shanghai Huitong Energy Co., Ltd's actual financial figures for swift evaluation.
- Endorsed by Industry Experts: Trusted by investors and analysts for making well-informed decisions.
Who Can Benefit from This Product?
- Institutional Investors: Develop comprehensive and trustworthy valuation models for portfolio assessments related to Shanghai Huitong Energy Co.,Ltd (600605SS).
- Corporate Finance Departments: Evaluate valuation scenarios to inform strategic decisions within the organization.
- Consultants and Financial Advisors: Equip clients with precise valuation insights for Shanghai Huitong Energy Co.,Ltd (600605SS).
- Students and Educators: Leverage real-time data for practicing and teaching financial modeling skills.
- Energy Sector Enthusiasts: Gain insights into how energy companies like Shanghai Huitong Energy Co.,Ltd (600605SS) are valued in the marketplace.
Contents of the Template
- Comprehensive DCF Model: Editable template featuring in-depth valuation calculations.
- Real-World Data: Shanghai Huitong Energy Co., Ltd's (600605SS) historical and projected financials preloaded for thorough analysis.
- Customizable Parameters: Modify WACC, growth rates, and tax assumptions to explore different scenarios.
- Financial Statements: Complete annual and quarterly breakdowns for enhanced insights.
- Key Ratios: Integrated analysis for assessing profitability, efficiency, and leverage.
- Dashboard with Visual Outputs: Charts and tables provide clear, actionable results.
Disclaimer
All information, articles, and product details provided on this website are for general informational and educational purposes only. We do not claim any ownership over, nor do we intend to infringe upon, any trademarks, copyrights, logos, brand names, or other intellectual property mentioned or depicted on this site. Such intellectual property remains the property of its respective owners, and any references here are made solely for identification or informational purposes, without implying any affiliation, endorsement, or partnership.
We make no representations or warranties, express or implied, regarding the accuracy, completeness, or suitability of any content or products presented. Nothing on this website should be construed as legal, tax, investment, financial, medical, or other professional advice. In addition, no part of this site—including articles or product references—constitutes a solicitation, recommendation, endorsement, advertisement, or offer to buy or sell any securities, franchises, or other financial instruments, particularly in jurisdictions where such activity would be unlawful.
All content is of a general nature and may not address the specific circumstances of any individual or entity. It is not a substitute for professional advice or services. Any actions you take based on the information provided here are strictly at your own risk. You accept full responsibility for any decisions or outcomes arising from your use of this website and agree to release us from any liability in connection with your use of, or reliance upon, the content or products found herein.