
|
Shanghai AJ Group Co., Ltd (600643.SS) Évaluation DCF |
Entièrement Modifiable: Adapté À Vos Besoins Dans Excel Ou Sheets
Conception Professionnelle: Modèles Fiables Et Conformes Aux Normes Du Secteur
Pré-Construits Pour Une Utilisation Rapide Et Efficace
Compatible MAC/PC, entièrement débloqué
Aucune Expertise N'Est Requise; Facile À Suivre
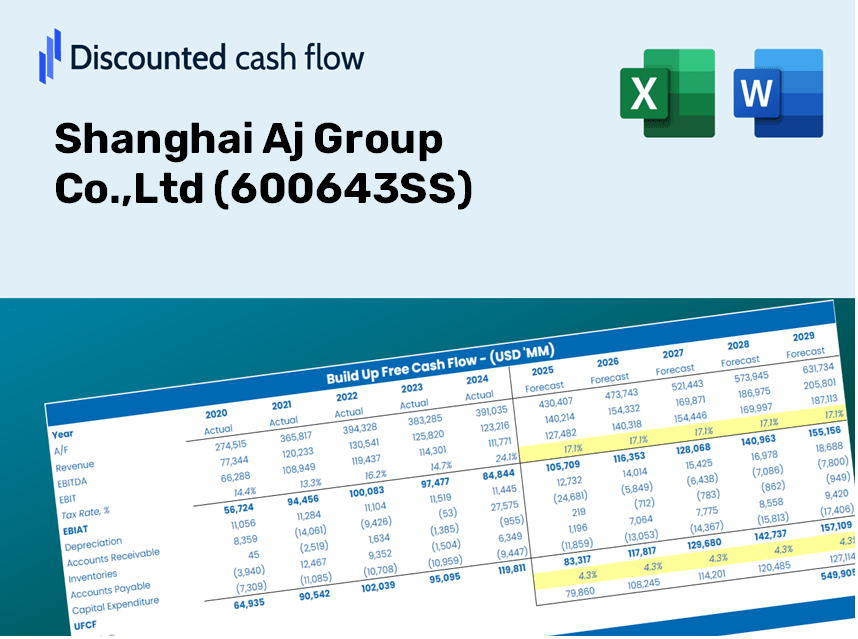
Shanghai Aj Group Co.,Ltd (600643.SS) Bundle
Explorez les perspectives financières de Shanghai AJ Group Co., Ltd (600643SS) avec notre calculatrice DCF conviviale! Entrez vos hypothèses concernant la croissance, les marges et les dépenses pour calculer la valeur intrinsèque de Shanghai AJ Group Co., Ltd (600643SS) et améliorez votre stratégie d'investissement.
Discounted Cash Flow (DCF) - (USD MM)
| Year | AY1 2020 |
AY2 2021 |
AY3 2022 |
AY4 2023 |
AY5 2024 |
FY1 2025 |
FY2 2026 |
FY3 2027 |
FY4 2028 |
FY5 2029 |
|---|---|---|---|---|---|---|---|---|---|---|
| Revenue | 4,376.9 | 4,322.5 | 3,008.4 | 2,418.0 | 1,976.0 | 1,632.4 | 1,348.6 | 1,114.1 | 920.4 | 760.4 |
| Revenue Growth, % | 0 | -1.24 | -30.4 | -19.62 | -18.28 | -17.39 | -17.39 | -17.39 | -17.39 | -17.39 |
| EBITDA | 2,360.6 | 2,007.0 | 1,363.8 | 915.3 | -157.3 | 573.3 | 473.6 | 391.3 | 323.2 | 267.0 |
| EBITDA, % | 53.93 | 46.43 | 45.33 | 37.86 | -7.96 | 35.12 | 35.12 | 35.12 | 35.12 | 35.12 |
| Depreciation | 271.9 | 276.9 | 280.2 | 243.3 | 215.8 | 140.1 | 115.8 | 95.6 | 79.0 | 65.3 |
| Depreciation, % | 6.21 | 6.41 | 9.31 | 10.06 | 10.92 | 8.58 | 8.58 | 8.58 | 8.58 | 8.58 |
| EBIT | 2,088.7 | 1,730.1 | 1,083.5 | 672.0 | -373.1 | 433.2 | 357.8 | 295.6 | 244.2 | 201.8 |
| EBIT, % | 47.72 | 40.03 | 36.02 | 27.79 | -18.88 | 26.54 | 26.54 | 26.54 | 26.54 | 26.54 |
| Total Cash | 3,653.0 | 3,866.2 | 3,302.2 | 2,337.1 | 1,939.9 | 1,527.1 | 1,261.5 | 1,042.2 | 861.0 | 711.3 |
| Total Cash, percent | .0 | .0 | .0 | .0 | .0 | .0 | .0 | .0 | .0 | .0 |
| Account Receivables | 3,235.9 | 1,153.4 | 1,304.7 | 3,833.5 | 961.0 | 955.3 | 789.2 | 652.0 | 538.6 | 445.0 |
| Account Receivables, % | 73.93 | 26.68 | 43.37 | 158.54 | 48.63 | 58.52 | 58.52 | 58.52 | 58.52 | 58.52 |
| Inventories | 6.2 | 38.3 | 67.5 | 65.9 | 211.7 | 54.6 | 45.1 | 37.2 | 30.8 | 25.4 |
| Inventories, % | 0.14103 | 0.88548 | 2.24 | 2.73 | 10.71 | 3.34 | 3.34 | 3.34 | 3.34 | 3.34 |
| Accounts Payable | 12.3 | 184.4 | 325.9 | 275.6 | 100.3 | 104.0 | 85.9 | 71.0 | 58.6 | 48.4 |
| Accounts Payable, % | 0.28132 | 4.27 | 10.83 | 11.4 | 5.07 | 6.37 | 6.37 | 6.37 | 6.37 | 6.37 |
| Capital Expenditure | -2,619.7 | -4,937.1 | -3,365.1 | -3,817.7 | -5,582.0 | -1,501.3 | -1,240.3 | -1,024.6 | -846.5 | -699.3 |
| Capital Expenditure, % | -59.85 | -114.22 | -111.86 | -157.89 | -282.49 | -91.97 | -91.97 | -91.97 | -91.97 | -91.97 |
| Tax Rate, % | 3.93 | 3.93 | 3.93 | 3.93 | 3.93 | 3.93 | 3.93 | 3.93 | 3.93 | 3.93 |
| EBITAT | 1,500.4 | 1,294.1 | 717.6 | 315.6 | -358.5 | 308.3 | 254.7 | 210.4 | 173.8 | 143.6 |
| Depreciation | ||||||||||
| Changes in Account Receivables | ||||||||||
| Changes in Inventories | ||||||||||
| Changes in Accounts Payable | ||||||||||
| Capital Expenditure | ||||||||||
| UFCF | -4,077.3 | -1,143.5 | -2,406.2 | -5,836.3 | -3,173.2 | -886.4 | -712.3 | -588.5 | -486.1 | -401.6 |
| WACC, % | 7.44 | 7.48 | 7.35 | 7.05 | 7.82 | 7.43 | 7.43 | 7.43 | 7.43 | 7.43 |
| PV UFCF | ||||||||||
| SUM PV UFCF | -2,562.7 | |||||||||
| Long Term Growth Rate, % | 2.00 | |||||||||
| Free cash flow (T + 1) | -410 | |||||||||
| Terminal Value | -7,549 | |||||||||
| Present Terminal Value | -5,276 | |||||||||
| Enterprise Value | -7,839 | |||||||||
| Net Debt | 5,470 | |||||||||
| Equity Value | -13,309 | |||||||||
| Diluted Shares Outstanding, MM | 1,609 | |||||||||
| Equity Value Per Share | -8.27 |
What You Will Receive
- Customizable Excel Template: A fully adaptable Excel-based DCF Calculator featuring pre-filled financial data for Shanghai Aj Group Co., Ltd (600643SS).
- Accurate Data: Historical figures and forward-looking projections (highlighted in the yellow cells).
- Adjustable Forecasts: Modify forecast assumptions such as revenue growth, EBITDA %, and WACC.
- Instant Calculations: Quickly observe how your inputs affect the valuation of Shanghai Aj Group Co., Ltd (600643SS).
- Professional Resource: Designed for investors, CFOs, consultants, and financial analysts.
- Intuitive Design: Organized for clarity and simplicity, featuring step-by-step guidance.
Key Features
- Customizable Forecast Inputs: Adjust essential metrics such as revenue growth, EBITDA percentages, and capital investments.
- Instant DCF Valuation: Automatically computes intrinsic value, NPV, and various financial outputs.
- High-Precision Accuracy: Leverages Shanghai Aj Group Co.,Ltd's (600643SS) actual financial data for precise valuation results.
- Streamlined Scenario Analysis: Effortlessly explore different assumptions and evaluate their impacts.
- Efficiency Boost: Save time by avoiding the complexity of developing valuation models from the ground up.
How It Functions
- Step 1: Download the ready-to-use Excel template featuring Shanghai Aj Group Co., Ltd's data.
- Step 2: Review the pre-populated sheets to grasp the essential metrics.
- Step 3: Modify the forecasts and assumptions in the editable yellow cells (WACC, growth, margins).
- Step 4: Instantly see the updated results, including the intrinsic value of Shanghai Aj Group Co., Ltd (600643SS).
- Step 5: Make well-informed investment choices or produce reports based on the generated outputs.
Why Choose This Calculator for Shanghai Aj Group Co., Ltd (600643SS)?
- All-in-One Resource: Features DCF, WACC, and financial ratio analyses consolidated into a single tool.
- Flexible Inputs: Modify the highlighted yellow cells to explore different scenarios.
- In-Depth Analysis: Automatically computes the intrinsic value and Net Present Value for Shanghai Aj Group Co., Ltd.
- Pre-Loaded Information: Comes with historical and projected data for accurate analysis.
- High-Quality Standards: Perfect for financial analysts, investors, and business consultants.
Who Should Use This Product?
- Investors: Evaluate the valuation of Shanghai Aj Group Co., Ltd (600643SS) before making investment decisions.
- CFOs and Financial Analysts: Optimize valuation methodologies and assess financial forecasts for accuracy.
- Startup Founders: Discover the valuation techniques applied to established firms like Shanghai Aj Group Co., Ltd (600643SS).
- Consultants: Produce detailed valuation reports to provide insights for your clients.
- Students and Educators: Utilize real market data to enhance the study and teaching of valuation practices.
Contents of the Template
- Historical Data: Contains Shanghai Aj Group Co., Ltd’s past financial performance and baseline forecasts.
- DCF and Levered DCF Models: Comprehensive templates for calculating the intrinsic value of Shanghai Aj Group Co., Ltd (600643SS).
- WACC Sheet: Pre-structured calculations for the Weighted Average Cost of Capital.
- Editable Inputs: Adjust essential drivers such as growth rates, EBITDA percentages, and CAPEX assumptions.
- Quarterly and Annual Statements: A thorough analysis of Shanghai Aj Group Co., Ltd’s financials.
- Interactive Dashboard: Dynamically visualize valuation results and projections.
Disclaimer
All information, articles, and product details provided on this website are for general informational and educational purposes only. We do not claim any ownership over, nor do we intend to infringe upon, any trademarks, copyrights, logos, brand names, or other intellectual property mentioned or depicted on this site. Such intellectual property remains the property of its respective owners, and any references here are made solely for identification or informational purposes, without implying any affiliation, endorsement, or partnership.
We make no representations or warranties, express or implied, regarding the accuracy, completeness, or suitability of any content or products presented. Nothing on this website should be construed as legal, tax, investment, financial, medical, or other professional advice. In addition, no part of this site—including articles or product references—constitutes a solicitation, recommendation, endorsement, advertisement, or offer to buy or sell any securities, franchises, or other financial instruments, particularly in jurisdictions where such activity would be unlawful.
All content is of a general nature and may not address the specific circumstances of any individual or entity. It is not a substitute for professional advice or services. Any actions you take based on the information provided here are strictly at your own risk. You accept full responsibility for any decisions or outcomes arising from your use of this website and agree to release us from any liability in connection with your use of, or reliance upon, the content or products found herein.