
|
Shanghai Chengtou Holding Co., Ltd (600649.SS) Évaluation DCF |
Entièrement Modifiable: Adapté À Vos Besoins Dans Excel Ou Sheets
Conception Professionnelle: Modèles Fiables Et Conformes Aux Normes Du Secteur
Pré-Construits Pour Une Utilisation Rapide Et Efficace
Compatible MAC/PC, entièrement débloqué
Aucune Expertise N'Est Requise; Facile À Suivre
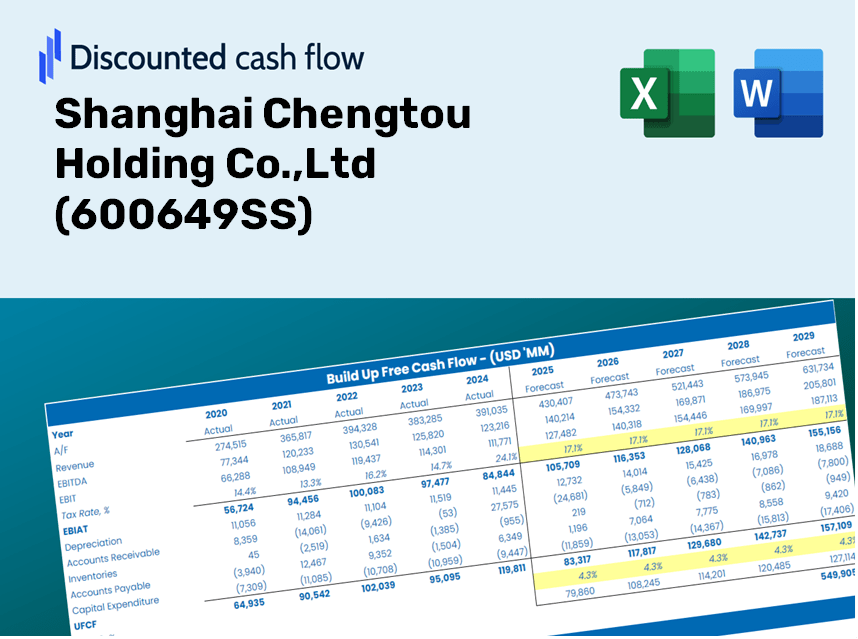
Shanghai Chengtou Holding Co.,Ltd (600649.SS) Bundle
Améliorez vos stratégies d'investissement avec la calculatrice DCF (600649SS)! Explorez de véritables données financières pour Shanghai Chengtou Holding Co., Ltd, ajustez les projections et dépenses de croissance et observez comment ces variations affectent la valeur intrinsèque de (600649SS) en temps réel.
What You Will Receive
- Accurate SHCH Financial Data: Pre-populated with Shanghai Chengtou Holding Co., Ltd’s historical and forecasted figures for detailed analysis.
- Customizable Template: Easily adjust critical inputs such as revenue growth, WACC, and EBITDA %.
- Instant Calculations: Observe real-time updates to Shanghai Chengtou's intrinsic value based on your adjustments.
- Expert Valuation Tool: Tailored for investors, analysts, and consultants aiming for precise DCF outcomes.
- Intuitive Interface: Designed with a straightforward format and clear guidelines suitable for all skill levels.
Key Features
- Comprehensive DCF Calculator: Features in-depth unlevered and levered DCF valuation frameworks.
- WACC Calculator: Ready-to-use Weighted Average Cost of Capital template with adjustable parameters.
- Customizable Forecast Assumptions: Update growth projections, capital investments, and discount rates.
- Integrated Financial Ratios: Assess profitability, leverage, and efficiency ratios for Shanghai Chengtou Holding Co., Ltd (600649SS).
- Dashboard and Visualizations: Graphical outputs provide a clear summary of essential valuation metrics for efficient analysis.
How It Works
- Step 1: Download the Excel file for Shanghai Chengtou Holding Co., Ltd (600649SS).
- Step 2: Examine the pre-filled financial data and projections for Shanghai Chengtou.
- Step 3: Adjust key inputs such as revenue growth, WACC, and tax rates (highlighted cells).
- Step 4: Observe the DCF model refresh in real time as you modify your assumptions.
- Step 5: Review the results and utilize the outputs for informed investment decisions.
Why Choose This Calculator for Shanghai Chengtou Holding Co., Ltd (600649SS)?
- Accurate Insights: Utilize real financial data from Shanghai Chengtou for dependable valuation outcomes.
- Customizable Features: Tailor essential parameters such as growth rates, WACC, and tax rates to fit your forecasts.
- Efficiency Boost: Built-in calculations save you the hassle of starting from scratch.
- Professional Quality: Crafted for investors, analysts, and financial consultants.
- User-Friendly Interface: An intuitive design with clear, step-by-step guidance caters to users of all experience levels.
Who Should Use This Product?
- Investors: Accurately assess the fair value of Shanghai Chengtou Holding Co., Ltd (600649SS) prior to making investment choices.
- CFOs: Utilize a professional-grade DCF model for comprehensive financial reporting and analysis.
- Consultants: Easily customize the template for client valuation reports.
- Entrepreneurs: Gain valuable insights into the financial modeling practices of leading companies.
- Educators: Employ it as a teaching resource to showcase various valuation methodologies.
What the Template Includes
- Operating and Balance Sheet Data: Pre-filled historical data and forecasts for Shanghai Chengtou Holding Co., Ltd (600649SS), encompassing revenue, EBITDA, EBIT, and capital expenditures.
- WACC Calculation: A separate sheet for calculating the Weighted Average Cost of Capital (WACC), detailing parameters such as Beta, risk-free rate, and share price.
- DCF Valuation (Unlevered and Levered): Customizable Discounted Cash Flow models that reveal intrinsic value with comprehensive calculations.
- Financial Statements: Pre-loaded financial statements (both annual and quarterly) to aid in analysis.
- Key Ratios: Contains profitability, leverage, and efficiency ratios relevant to Shanghai Chengtou Holding Co., Ltd (600649SS).
- Dashboard and Charts: A visual summary of valuation outputs and underlying assumptions for easy result analysis.
Disclaimer
All information, articles, and product details provided on this website are for general informational and educational purposes only. We do not claim any ownership over, nor do we intend to infringe upon, any trademarks, copyrights, logos, brand names, or other intellectual property mentioned or depicted on this site. Such intellectual property remains the property of its respective owners, and any references here are made solely for identification or informational purposes, without implying any affiliation, endorsement, or partnership.
We make no representations or warranties, express or implied, regarding the accuracy, completeness, or suitability of any content or products presented. Nothing on this website should be construed as legal, tax, investment, financial, medical, or other professional advice. In addition, no part of this site—including articles or product references—constitutes a solicitation, recommendation, endorsement, advertisement, or offer to buy or sell any securities, franchises, or other financial instruments, particularly in jurisdictions where such activity would be unlawful.
All content is of a general nature and may not address the specific circumstances of any individual or entity. It is not a substitute for professional advice or services. Any actions you take based on the information provided here are strictly at your own risk. You accept full responsibility for any decisions or outcomes arising from your use of this website and agree to release us from any liability in connection with your use of, or reliance upon, the content or products found herein.