
|
Beijing Electronic Zone Investment and Development Group Co., Ltd. (600658.SS) Valation DCF |
Entièrement Modifiable: Adapté À Vos Besoins Dans Excel Ou Sheets
Conception Professionnelle: Modèles Fiables Et Conformes Aux Normes Du Secteur
Pré-Construits Pour Une Utilisation Rapide Et Efficace
Compatible MAC/PC, entièrement débloqué
Aucune Expertise N'Est Requise; Facile À Suivre
Beijing Electronic Zone Investment and Development Group Co., Ltd. (600658.SS) Bundle
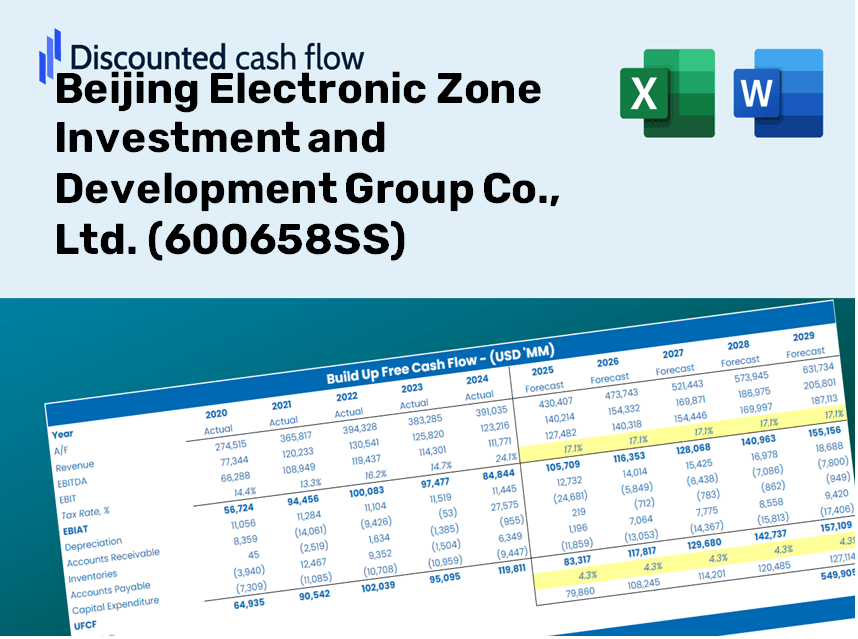
Gardez un aperçu de votre Pékin Electronic Zone Investment and Development Group Co., Ltd. (600658SS) Analyse d'évaluation à l'aide de notre calculatrice sophistiquée DCF! Ce modèle Excel est préchargé avec des données réelles (600658SS), vous permettant d'ajuster les prévisions et les hypothèses pour calculer précisément la valeur intrinsèque de Beijing Electronic Zone Investment and Development Group Co., Ltd.
Discounted Cash Flow (DCF) - (USD MM)
| Year | AY1 2020 |
AY2 2021 |
AY3 2022 |
AY4 2023 |
AY5 2024 |
FY1 2025 |
FY2 2026 |
FY3 2027 |
FY4 2028 |
FY5 2029 |
|---|---|---|---|---|---|---|---|---|---|---|
| Revenue | 3,770.5 | 1,964.5 | 5,149.7 | 2,811.6 | 2,111.5 | 2,015.5 | 1,923.8 | 1,836.2 | 1,752.7 | 1,672.9 |
| Revenue Growth, % | 0 | -47.9 | 162.13 | -45.4 | -24.9 | -4.55 | -4.55 | -4.55 | -4.55 | -4.55 |
| EBITDA | 1,040.0 | 806.1 | 1,415.3 | 577.3 | -527.3 | 369.5 | 352.7 | 336.6 | 321.3 | 306.7 |
| EBITDA, % | 27.58 | 41.03 | 27.48 | 20.53 | -24.97 | 18.33 | 18.33 | 18.33 | 18.33 | 18.33 |
| Depreciation | 85.6 | 429.7 | 440.3 | 393.8 | 307.9 | 247.0 | 235.8 | 225.1 | 214.8 | 205.1 |
| Depreciation, % | 2.27 | 21.87 | 8.55 | 14.01 | 14.58 | 12.26 | 12.26 | 12.26 | 12.26 | 12.26 |
| EBIT | 954.3 | 376.3 | 975.0 | 183.6 | -835.3 | 122.4 | 116.9 | 111.5 | 106.5 | 101.6 |
| EBIT, % | 25.31 | 19.16 | 18.93 | 6.53 | -39.56 | 6.07 | 6.07 | 6.07 | 6.07 | 6.07 |
| Total Cash | 3,848.2 | 4,097.4 | 2,877.9 | 1,906.5 | 1,373.0 | 1,566.9 | 1,495.6 | 1,427.6 | 1,362.6 | 1,300.6 |
| Total Cash, percent | .0 | .0 | .0 | .0 | .0 | .0 | .0 | .0 | .0 | .0 |
| Account Receivables | 811.8 | 483.9 | 1,397.0 | 905.9 | 1,043.6 | 624.5 | 596.1 | 569.0 | 543.1 | 518.4 |
| Account Receivables, % | 21.53 | 24.63 | 27.13 | 32.22 | 49.42 | 30.99 | 30.99 | 30.99 | 30.99 | 30.99 |
| Inventories | 8,925.4 | 10,443.3 | 8,805.2 | 7,678.3 | 6,762.5 | 2,015.5 | 1,923.8 | 1,836.2 | 1,752.7 | 1,672.9 |
| Inventories, % | 236.72 | 531.59 | 170.99 | 273.1 | 320.27 | 100 | 100 | 100 | 100 | 100 |
| Accounts Payable | 1,476.5 | 1,483.8 | 1,972.0 | 1,494.4 | 1,835.8 | 1,181.4 | 1,127.6 | 1,076.3 | 1,027.3 | 980.6 |
| Accounts Payable, % | 39.16 | 75.53 | 38.29 | 53.15 | 86.94 | 58.62 | 58.62 | 58.62 | 58.62 | 58.62 |
| Capital Expenditure | -97.2 | -218.9 | -131.0 | -146.4 | -228.6 | -130.2 | -124.3 | -118.6 | -113.2 | -108.1 |
| Capital Expenditure, % | -2.58 | -11.14 | -2.54 | -5.21 | -10.83 | -6.46 | -6.46 | -6.46 | -6.46 | -6.46 |
| Tax Rate, % | -43.7 | -43.7 | -43.7 | -43.7 | -43.7 | -43.7 | -43.7 | -43.7 | -43.7 | -43.7 |
| EBITAT | 674.8 | 263.9 | 813.0 | 662.6 | -1,200.3 | 103.9 | 99.1 | 94.6 | 90.3 | 86.2 |
| Depreciation | ||||||||||
| Changes in Account Receivables | ||||||||||
| Changes in Inventories | ||||||||||
| Changes in Accounts Payable | ||||||||||
| Capital Expenditure | ||||||||||
| UFCF | -7,597.4 | -708.0 | 2,335.5 | 2,050.3 | -1.3 | 4,732.3 | 277.0 | 264.4 | 252.4 | 240.9 |
| WACC, % | 6.52 | 6.51 | 6.84 | 7.27 | 7.27 | 6.88 | 6.88 | 6.88 | 6.88 | 6.88 |
| PV UFCF | ||||||||||
| SUM PV UFCF | 5,252.9 | |||||||||
| Long Term Growth Rate, % | 1.00 | |||||||||
| Free cash flow (T + 1) | 243 | |||||||||
| Terminal Value | 4,138 | |||||||||
| Present Terminal Value | 2,967 | |||||||||
| Enterprise Value | 8,220 | |||||||||
| Net Debt | 4,139 | |||||||||
| Equity Value | 4,080 | |||||||||
| Diluted Shares Outstanding, MM | 1,120 | |||||||||
| Equity Value Per Share | 3.64 |
What You Will Receive
- Genuine Beijing Electronic Data: Preloaded financial metrics – from revenue to EBIT – based on actual and projected figures for Beijing Electronic Zone Investment and Development Group Co., Ltd. (600658SS).
- Comprehensive Customization: Modify essential parameters (yellow cells) such as WACC, growth rate, and tax percentages to fit your analysis.
- Real-Time Valuation Adjustments: Automatic updates to evaluate the effects of changes on the fair value of Beijing Electronic Zone Investment and Development Group Co., Ltd. (600658SS).
- Flexible Excel Template: Designed for easy modifications, scenario analysis, and in-depth forecasting.
- Efficient and Precise: Eliminate the need to create models from the ground up while ensuring accuracy and adaptability.
Key Features
- Customizable Forecast Inputs: Adjust essential metrics such as revenue growth, EBITDA %, and capital expenditures.
- Instant DCF Valuation: Quickly computes intrinsic value, NPV, and other key financial metrics.
- High Precision Accuracy: Incorporates real-world financial data from Apple for realistic valuation results.
- Effortless Scenario Analysis: Easily test various assumptions and evaluate outcomes side-by-side.
- Efficiency Boosting Tool: Remove the complexity of creating intricate valuation models from the ground up.
How It Works
- Step 1: Download the Excel file.
- Step 2: Review pre-entered Beijing Electronic Zone data (historical and projected).
- Step 3: Adjust key assumptions (yellow cells) based on your analysis.
- Step 4: View automatic recalculations for Beijing Electronic Zone’s intrinsic value.
- Step 5: Utilize the outputs for your investment decisions or reporting purposes.
Why Select This Calculator for Beijing Electronic Zone Investment and Development Group Co., Ltd. (600658SS)?
- All-in-One Solution: Offers DCF, WACC, and financial ratio analyses seamlessly integrated.
- Flexible Inputs: Modify the yellow-highlighted fields to explore different financial scenarios.
- Comprehensive Analysis: Automatically computes the intrinsic value and Net Present Value for Beijing Electronic Zone Investment.
- Ready-to-Use Data: Features both historical and projected data for precise calculations.
- High Standards: Perfect for financial analysts, investors, and consultants in the industry.
Who Should Benefit from Our Services?
- Individual Investors: Gain insights to make well-informed decisions regarding investments in Beijing Electronic Zone Investment and Development Group Co., Ltd. (600658SS).
- Financial Analysts: Enhance your valuation processes with our comprehensive financial models tailored for (600658SS).
- Consultants: Provide your clients with accurate and timely valuation assessments of (600658SS).
- Business Owners: Learn how major companies like Beijing Electronic Zone Investment and Development Group Co., Ltd. (600658SS) are valued to shape your business strategies.
- Finance Students: Explore valuation methodologies using practical data and case studies related to (600658SS).
What the Template Contains
- Comprehensive DCF Model: Editable template featuring thorough valuation calculations.
- Real-World Data: Beijing Electronic Zone Investment and Development Group Co., Ltd.'s (600658SS) historical and projected financials preloaded for in-depth analysis.
- Customizable Parameters: Modify WACC, growth rates, and tax assumptions to explore different scenarios.
- Financial Statements: Complete annual and quarterly breakdowns for enhanced insights.
- Key Ratios: Integrated analysis for profitability, efficiency, and leverage metrics.
- Dashboard with Visual Outputs: Charts and tables that provide clear, actionable results.
Disclaimer
All information, articles, and product details provided on this website are for general informational and educational purposes only. We do not claim any ownership over, nor do we intend to infringe upon, any trademarks, copyrights, logos, brand names, or other intellectual property mentioned or depicted on this site. Such intellectual property remains the property of its respective owners, and any references here are made solely for identification or informational purposes, without implying any affiliation, endorsement, or partnership.
We make no representations or warranties, express or implied, regarding the accuracy, completeness, or suitability of any content or products presented. Nothing on this website should be construed as legal, tax, investment, financial, medical, or other professional advice. In addition, no part of this site—including articles or product references—constitutes a solicitation, recommendation, endorsement, advertisement, or offer to buy or sell any securities, franchises, or other financial instruments, particularly in jurisdictions where such activity would be unlawful.
All content is of a general nature and may not address the specific circumstances of any individual or entity. It is not a substitute for professional advice or services. Any actions you take based on the information provided here are strictly at your own risk. You accept full responsibility for any decisions or outcomes arising from your use of this website and agree to release us from any liability in connection with your use of, or reliance upon, the content or products found herein.