
|
Wuxi Taiji Industry Limited Corporation (600667.SS) Évaluation DCF |
Entièrement Modifiable: Adapté À Vos Besoins Dans Excel Ou Sheets
Conception Professionnelle: Modèles Fiables Et Conformes Aux Normes Du Secteur
Pré-Construits Pour Une Utilisation Rapide Et Efficace
Compatible MAC/PC, entièrement débloqué
Aucune Expertise N'Est Requise; Facile À Suivre
Wuxi Taiji Industry Limited Corporation (600667.SS) Bundle
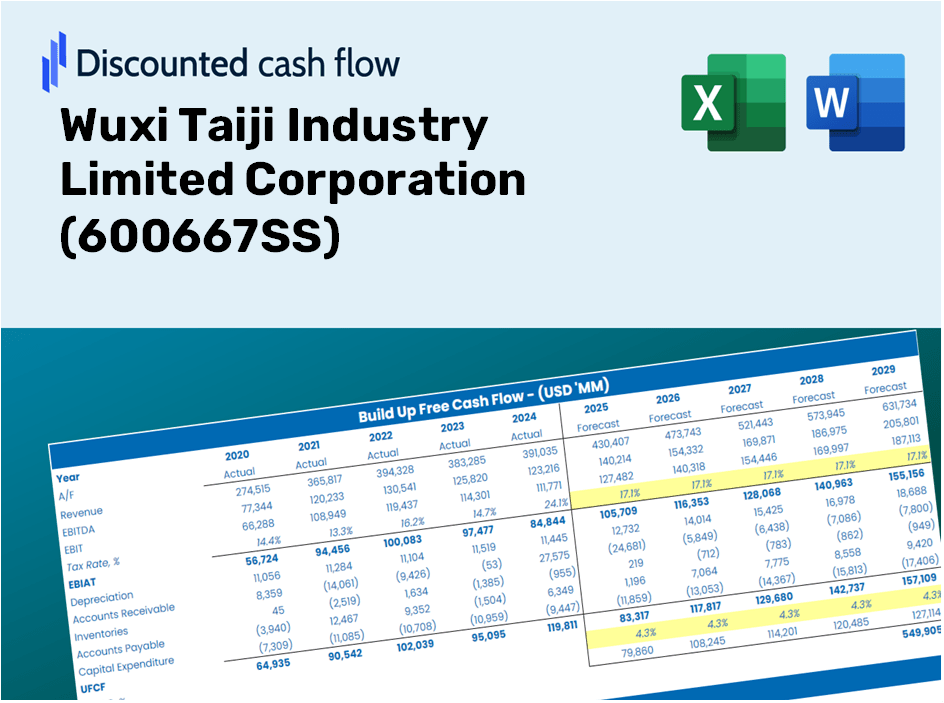
Que vous soyez un investisseur ou un analyste, cette calculatrice DCF (600667SS) est votre outil essentiel pour une évaluation précise. Chargé de données réelles de Wuxi Taiji Industry Limited Corporation, vous pouvez ajuster les prévisions et observer les effets en temps réel.
Discounted Cash Flow (DCF) - (USD MM)
| Year | AY1 2020 |
AY2 2021 |
AY3 2022 |
AY4 2023 |
AY5 2024 |
FY1 2025 |
FY2 2026 |
FY3 2027 |
FY4 2028 |
FY5 2029 |
|---|---|---|---|---|---|---|---|---|---|---|
| Revenue | 17,846.3 | 24,289.1 | 35,194.8 | 39,376.8 | 35,172.1 | 35,395.6 | 35,620.4 | 35,846.7 | 36,074.3 | 36,303.5 |
| Revenue Growth, % | 0 | 36.1 | 44.9 | 11.88 | -10.68 | 0.6352 | 0.6352 | 0.6352 | 0.6352 | 0.6352 |
| EBITDA | 1,830.5 | 1,921.6 | 734.3 | 1,712.6 | 1,485.3 | 2,040.7 | 2,053.7 | 2,066.7 | 2,079.9 | 2,093.1 |
| EBITDA, % | 10.26 | 7.91 | 2.09 | 4.35 | 4.22 | 5.77 | 5.77 | 5.77 | 5.77 | 5.77 |
| Depreciation | 798.3 | 776.4 | 743.0 | 732.8 | 671.9 | 959.4 | 965.5 | 971.6 | 977.8 | 984.0 |
| Depreciation, % | 4.47 | 3.2 | 2.11 | 1.86 | 1.91 | 2.71 | 2.71 | 2.71 | 2.71 | 2.71 |
| EBIT | 1,032.2 | 1,145.3 | -8.7 | 979.9 | 813.4 | 1,081.3 | 1,088.2 | 1,095.1 | 1,102.1 | 1,109.1 |
| EBIT, % | 5.78 | 4.72 | -0.02474111 | 2.49 | 2.31 | 3.06 | 3.06 | 3.06 | 3.06 | 3.06 |
| Total Cash | 4,388.4 | 6,328.5 | 7,168.6 | 7,499.9 | 7,279.0 | 7,840.5 | 7,890.3 | 7,940.4 | 7,990.8 | 8,041.6 |
| Total Cash, percent | .0 | .0 | .0 | .0 | .0 | .0 | .0 | .0 | .0 | .0 |
| Account Receivables | 6,599.2 | 7,585.5 | 10,938.2 | 13,644.4 | 15,219.1 | 12,544.8 | 12,624.4 | 12,704.6 | 12,785.3 | 12,866.5 |
| Account Receivables, % | 36.98 | 31.23 | 31.08 | 34.65 | 43.27 | 35.44 | 35.44 | 35.44 | 35.44 | 35.44 |
| Inventories | 694.0 | 1,086.5 | 897.2 | 1,576.7 | 514.6 | 1,159.4 | 1,166.8 | 1,174.2 | 1,181.7 | 1,189.2 |
| Inventories, % | 3.89 | 4.47 | 2.55 | 4 | 1.46 | 3.28 | 3.28 | 3.28 | 3.28 | 3.28 |
| Accounts Payable | 5,536.1 | 6,841.1 | 10,529.9 | 14,128.9 | 16,229.2 | 12,114.4 | 12,191.4 | 12,268.8 | 12,346.7 | 12,425.2 |
| Accounts Payable, % | 31.02 | 28.17 | 29.92 | 35.88 | 46.14 | 34.23 | 34.23 | 34.23 | 34.23 | 34.23 |
| Capital Expenditure | -684.6 | -584.0 | -494.7 | -538.4 | -260.0 | -690.4 | -694.8 | -699.2 | -703.6 | -708.1 |
| Capital Expenditure, % | -3.84 | -2.4 | -1.41 | -1.37 | -0.73923 | -1.95 | -1.95 | -1.95 | -1.95 | -1.95 |
| Tax Rate, % | 28.52 | 28.52 | 28.52 | 28.52 | 28.52 | 28.52 | 28.52 | 28.52 | 28.52 | 28.52 |
| EBITAT | 813.2 | 919.8 | -10.5 | 750.9 | 581.4 | 880.7 | 886.3 | 891.9 | 897.6 | 903.3 |
| Depreciation | ||||||||||
| Changes in Account Receivables | ||||||||||
| Changes in Inventories | ||||||||||
| Changes in Accounts Payable | ||||||||||
| Capital Expenditure | ||||||||||
| UFCF | -830.2 | 1,038.4 | 763.2 | 1,158.7 | 2,580.8 | -935.5 | 1,146.9 | 1,154.1 | 1,161.5 | 1,168.9 |
| WACC, % | 5.77 | 5.78 | 5.98 | 5.75 | 5.69 | 5.79 | 5.79 | 5.79 | 5.79 | 5.79 |
| PV UFCF | ||||||||||
| SUM PV UFCF | 2,924.2 | |||||||||
| Long Term Growth Rate, % | 3.50 | |||||||||
| Free cash flow (T + 1) | 1,210 | |||||||||
| Terminal Value | 52,733 | |||||||||
| Present Terminal Value | 39,790 | |||||||||
| Enterprise Value | 42,714 | |||||||||
| Net Debt | -3,932 | |||||||||
| Equity Value | 46,646 | |||||||||
| Diluted Shares Outstanding, MM | 2,121 | |||||||||
| Equity Value Per Share | 22.00 |
What You Will Receive
- Authentic Wuxi Taiji Data: Preloaded financial metrics – from revenue to EBIT – derived from actual and projected statistics.
- Complete Customization: Modify all essential parameters (yellow cells) such as WACC, growth %, and tax rates.
- Real-Time Valuation Updates: Automatic recalculations to assess the effects of changes on Wuxi Taiji’s fair value.
- Flexible Excel Template: Designed for quick modifications, scenario analysis, and comprehensive projections.
- Efficient and Precise: Avoid starting from scratch while ensuring accuracy and adaptability.
Key Features
- 🔍 Real-Life Wuxi Taiji Financials: Pre-filled historical and projected data for Wuxi Taiji Industry Limited Corporation (600667SS).
- ✏️ Fully Customizable Inputs: Adjust all key parameters (yellow cells) such as WACC, growth %, and tax rates.
- 📊 Professional DCF Valuation: Integrated formulas compute Wuxi Taiji’s intrinsic value using the Discounted Cash Flow method.
- ⚡ Instant Results: Immediately visualize Wuxi Taiji’s valuation after any adjustments.
- Scenario Analysis: Evaluate and compare different financial assumptions side-by-side.
How It Functions
- Obtain the Template: Gain immediate access to the Excel-based Wuxi Taiji DCF Calculator for [600667SS].
- Enter Your Assumptions: Modify the yellow-highlighted cells for growth rates, WACC, profit margins, and other variables.
- Automatic Calculations: The model will instantly update the intrinsic value of Wuxi Taiji.
- Run Scenarios: Experiment with various assumptions to assess potential changes in valuation.
- Evaluate and Decide: Utilize the findings to inform your investment or financial evaluation.
Why Opt for the Wuxi Taiji Industry Limited Corporation (600667SS) Calculator?
- Time-Saving: Skip the hassle of building a DCF model from zero – our calculator is ready to go.
- Enhanced Accuracy: Dependable financial data and formulas minimize valuation errors.
- Completely Customizable: Adjust the model to align with your assumptions and forecasts.
- Simple to Understand: Intuitive charts and outputs facilitate easy analysis of results.
- Endorsed by Professionals: Crafted for experts who prioritize precision and user-friendliness.
Who Can Benefit from Wuxi Taiji Industry Limited Corporation (600667SS)?
- Investors: Elevate your investment strategies with reliable insights from a leading industry player.
- Financial Analysts: Streamline your analysis with comprehensive data and resources tailored for detailed assessments.
- Consultants: Effortlessly modify reports and presentations to meet client needs with our adaptable frameworks.
- Industry Enthusiasts: Expand your knowledge of industry trends and practices through practical, real-world applications.
- Educators and Students: Utilize our resources as a hands-on learning aid in finance and business courses.
Contents of the Template
- In-Depth DCF Model: Editable template featuring comprehensive valuation calculations.
- Real-World Data: Wuxi Taiji Industry Limited Corporation's historical and projected financials preloaded for thorough analysis.
- Customizable Parameters: Modify WACC, growth rates, and tax assumptions to explore various scenarios.
- Financial Statements: Complete annual and quarterly breakdowns for enhanced insights.
- Key Ratios: Inherent analysis for profitability, efficiency, and leverage metrics.
- Dashboard with Visual Outputs: Charts and tables designed for clear, actionable insights.
Disclaimer
All information, articles, and product details provided on this website are for general informational and educational purposes only. We do not claim any ownership over, nor do we intend to infringe upon, any trademarks, copyrights, logos, brand names, or other intellectual property mentioned or depicted on this site. Such intellectual property remains the property of its respective owners, and any references here are made solely for identification or informational purposes, without implying any affiliation, endorsement, or partnership.
We make no representations or warranties, express or implied, regarding the accuracy, completeness, or suitability of any content or products presented. Nothing on this website should be construed as legal, tax, investment, financial, medical, or other professional advice. In addition, no part of this site—including articles or product references—constitutes a solicitation, recommendation, endorsement, advertisement, or offer to buy or sell any securities, franchises, or other financial instruments, particularly in jurisdictions where such activity would be unlawful.
All content is of a general nature and may not address the specific circumstances of any individual or entity. It is not a substitute for professional advice or services. Any actions you take based on the information provided here are strictly at your own risk. You accept full responsibility for any decisions or outcomes arising from your use of this website and agree to release us from any liability in connection with your use of, or reliance upon, the content or products found herein.