
|
Caihong Display Devices Co., Ltd. (600707.SS) Évaluation DCF |
Entièrement Modifiable: Adapté À Vos Besoins Dans Excel Ou Sheets
Conception Professionnelle: Modèles Fiables Et Conformes Aux Normes Du Secteur
Pré-Construits Pour Une Utilisation Rapide Et Efficace
Compatible MAC/PC, entièrement débloqué
Aucune Expertise N'Est Requise; Facile À Suivre
Caihong Display Devices Co.,Ltd. (600707.SS) Bundle
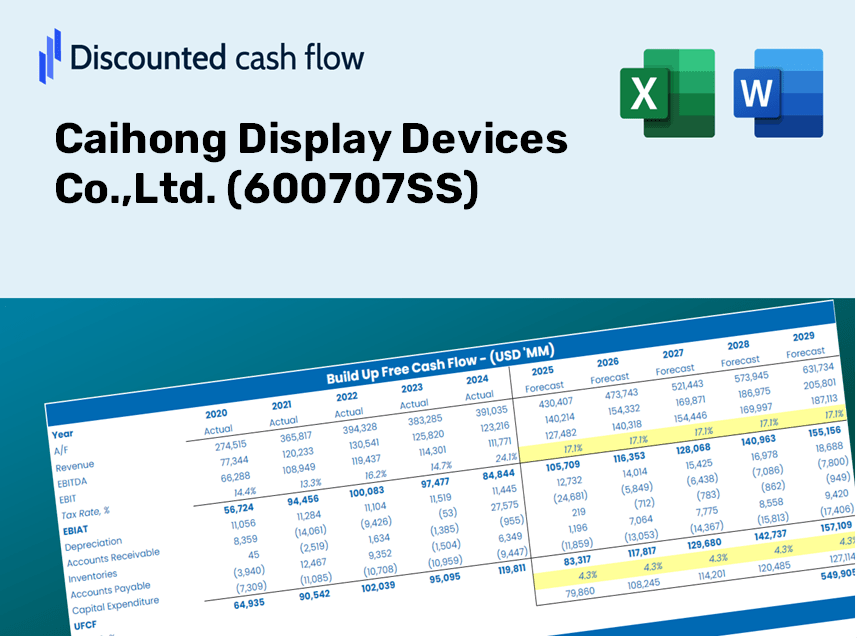
Évaluez les perspectives financières de Caihong Display Devices Co., Ltd. Comme un expert! Cette calculatrice DCF (600707SS) fournit des données financières pré-remplies et vous permet de compléter la flexibilité pour modifier la croissance des revenus, le WACC, les marges et d'autres hypothèses essentielles pour s'aligner sur vos projections.
Discounted Cash Flow (DCF) - (USD MM)
| Year | AY1 2020 |
AY2 2021 |
AY3 2022 |
AY4 2023 |
AY5 2024 |
FY1 2025 |
FY2 2026 |
FY3 2027 |
FY4 2028 |
FY5 2029 |
|---|---|---|---|---|---|---|---|---|---|---|
| Revenue | 10,448.0 | 15,173.6 | 8,967.0 | 11,465.5 | 11,663.8 | 12,652.9 | 13,725.9 | 14,889.8 | 16,152.5 | 17,522.2 |
| Revenue Growth, % | 0 | 45.23 | -40.9 | 27.86 | 1.73 | 8.48 | 8.48 | 8.48 | 8.48 | 8.48 |
| EBITDA | 1,854.5 | 6,228.6 | 922.5 | 4,126.1 | 4,780.5 | 3,696.2 | 4,009.6 | 4,349.6 | 4,718.4 | 5,118.6 |
| EBITDA, % | 17.75 | 41.05 | 10.29 | 35.99 | 40.99 | 29.21 | 29.21 | 29.21 | 29.21 | 29.21 |
| Depreciation | 2,102.7 | 2,552.8 | 2,907.2 | 2,942.3 | 3,118.1 | 3,081.4 | 3,342.7 | 3,626.2 | 3,933.7 | 4,267.2 |
| Depreciation, % | 20.13 | 16.82 | 32.42 | 25.66 | 26.73 | 24.35 | 24.35 | 24.35 | 24.35 | 24.35 |
| EBIT | -248.3 | 3,675.8 | -1,984.7 | 1,183.8 | 1,662.4 | 614.7 | 666.9 | 723.4 | 784.8 | 851.3 |
| EBIT, % | -2.38 | 24.22 | -22.13 | 10.32 | 14.25 | 4.86 | 4.86 | 4.86 | 4.86 | 4.86 |
| Total Cash | 6,926.6 | 9,380.7 | 8,992.4 | 5,459.5 | 6,266.7 | 8,337.3 | 9,044.3 | 9,811.3 | 10,643.3 | 11,545.8 |
| Total Cash, percent | .0 | .0 | .0 | .0 | .0 | .0 | .0 | .0 | .0 | .0 |
| Account Receivables | 2,027.8 | 2,471.6 | 1,433.0 | 2,499.1 | 1,960.7 | 2,284.7 | 2,478.5 | 2,688.7 | 2,916.6 | 3,164.0 |
| Account Receivables, % | 19.41 | 16.29 | 15.98 | 21.8 | 16.81 | 18.06 | 18.06 | 18.06 | 18.06 | 18.06 |
| Inventories | 566.0 | 1,387.3 | 876.7 | 889.8 | 1,077.2 | 1,046.0 | 1,134.7 | 1,230.9 | 1,335.3 | 1,448.5 |
| Inventories, % | 5.42 | 9.14 | 9.78 | 7.76 | 9.23 | 8.27 | 8.27 | 8.27 | 8.27 | 8.27 |
| Accounts Payable | 4,219.0 | 4,279.0 | 2,421.1 | 3,524.5 | 3,190.7 | 3,888.9 | 4,218.7 | 4,576.4 | 4,964.5 | 5,385.5 |
| Accounts Payable, % | 40.38 | 28.2 | 27 | 30.74 | 27.36 | 30.74 | 30.74 | 30.74 | 30.74 | 30.74 |
| Capital Expenditure | -3,132.8 | -4,035.0 | -4,134.7 | -2,617.5 | -3,310.5 | -3,894.6 | -4,224.8 | -4,583.1 | -4,971.7 | -5,393.3 |
| Capital Expenditure, % | -29.98 | -26.59 | -46.11 | -22.83 | -28.38 | -30.78 | -30.78 | -30.78 | -30.78 | -30.78 |
| Tax Rate, % | -0.75501 | -0.75501 | -0.75501 | -0.75501 | -0.75501 | -0.75501 | -0.75501 | -0.75501 | -0.75501 | -0.75501 |
| EBITAT | -247.7 | 3,223.9 | -2,032.8 | 1,181.4 | 1,674.9 | 599.1 | 649.9 | 705.0 | 764.8 | 829.7 |
| Depreciation | ||||||||||
| Changes in Account Receivables | ||||||||||
| Changes in Inventories | ||||||||||
| Changes in Accounts Payable | ||||||||||
| Capital Expenditure | ||||||||||
| UFCF | 347.3 | 536.7 | -3,569.1 | 1,530.5 | 1,499.8 | 191.3 | -184.9 | -200.5 | -217.6 | -236.0 |
| WACC, % | 8.69 | 8.5 | 8.69 | 8.69 | 8.69 | 8.65 | 8.65 | 8.65 | 8.65 | 8.65 |
| PV UFCF | ||||||||||
| SUM PV UFCF | -448.9 | |||||||||
| Long Term Growth Rate, % | 2.00 | |||||||||
| Free cash flow (T + 1) | -241 | |||||||||
| Terminal Value | -3,618 | |||||||||
| Present Terminal Value | -2,390 | |||||||||
| Enterprise Value | -2,838 | |||||||||
| Net Debt | 2,035 | |||||||||
| Equity Value | -4,873 | |||||||||
| Diluted Shares Outstanding, MM | 3,588 | |||||||||
| Equity Value Per Share | -1.36 |
What You Will Receive
- Customizable Excel Template: A fully adaptable Excel-based DCF Calculator featuring pre-loaded financial data for Caihong Display Devices Co., Ltd. (600707SS).
- Accurate Historical Data: Access to past performance metrics and forward-looking projections (highlighted in the yellow cells).
- Flexible Forecasting: Adjust key assumptions such as revenue growth, EBITDA margin, and weighted average cost of capital (WACC).
- Instant Calculations: Quickly observe how your assumptions affect the valuation of Caihong Display Devices Co., Ltd. (600707SS).
- Professional Resource: Designed for investors, financial officers, consultants, and analysts.
- User-Friendly Interface: Organized for easy navigation and comprehension, complete with detailed instructions.
Key Features
- 🔍 Real-Life CAIH Financials: Pre-filled historical and projected data for Caihong Display Devices Co., Ltd. (600707SS).
- ✏️ Fully Customizable Inputs: Modify all essential parameters (yellow cells) such as WACC, growth rate, and tax percentages.
- 📊 Professional DCF Valuation: Integrated formulas to determine the intrinsic value of Caihong Display Devices using the Discounted Cash Flow approach.
- ⚡ Instant Results: View Caihong's valuation immediately after adjusting any inputs.
- Scenario Analysis: Evaluate and compare results for different financial assumptions side-by-side.
How It Functions
- Download: Obtain the pre-formatted Excel file containing financial data for Caihong Display Devices Co., Ltd. (600707SS).
- Customize: Modify forecasts such as revenue growth, EBITDA %, and WACC to suit your analysis.
- Update Automatically: Real-time updates for the intrinsic value and NPV calculations as you make changes.
- Test Scenarios: Develop various projections and instantly compare their outcomes.
- Make Decisions: Leverage the valuation insights to inform your investment choices.
Why Opt for This Calculator?
- Designed for Experts: A sophisticated tool utilized by analysts, CFOs, and consultants.
- Accurate Data: Caihong Display Devices Co., Ltd.’s historical and projected financials preloaded for precision.
- Forecast Scenarios: Easily simulate various projections and assumptions.
- Comprehensive Results: Automatically computes intrinsic value, NPV, and essential metrics.
- User-Friendly: Step-by-step guidance leads you through the entire process.
Who Can Benefit from This Product?
- Investors: Assess Caihong Display Devices Co., Ltd.’s (600707SS) valuation prior to trading decisions.
- CFOs and Financial Analysts: Enhance valuation workflows and evaluate financial forecasts.
- Startup Founders: Discover how leading public companies like Caihong are appraised in the market.
- Consultants: Create detailed valuation reports for your clientele.
- Students and Educators: Utilize real-world examples to practice and teach valuation methods.
Contents of the Template
- Pre-Filled Data: Contains Caihong Display Devices Co., Ltd.'s historical financials and projections.
- Discounted Cash Flow Model: An editable DCF valuation model featuring automatic calculations.
- Weighted Average Cost of Capital (WACC): A specific sheet for calculating WACC using customized inputs.
- Key Financial Ratios: Evaluate Caihong's profitability, efficiency, and leverage.
- Customizable Inputs: Easily modify revenue growth, profit margins, and tax rates.
- Intuitive Dashboard: Visualizations and tables that highlight essential valuation metrics.
Disclaimer
All information, articles, and product details provided on this website are for general informational and educational purposes only. We do not claim any ownership over, nor do we intend to infringe upon, any trademarks, copyrights, logos, brand names, or other intellectual property mentioned or depicted on this site. Such intellectual property remains the property of its respective owners, and any references here are made solely for identification or informational purposes, without implying any affiliation, endorsement, or partnership.
We make no representations or warranties, express or implied, regarding the accuracy, completeness, or suitability of any content or products presented. Nothing on this website should be construed as legal, tax, investment, financial, medical, or other professional advice. In addition, no part of this site—including articles or product references—constitutes a solicitation, recommendation, endorsement, advertisement, or offer to buy or sell any securities, franchises, or other financial instruments, particularly in jurisdictions where such activity would be unlawful.
All content is of a general nature and may not address the specific circumstances of any individual or entity. It is not a substitute for professional advice or services. Any actions you take based on the information provided here are strictly at your own risk. You accept full responsibility for any decisions or outcomes arising from your use of this website and agree to release us from any liability in connection with your use of, or reliance upon, the content or products found herein.