
|
NEUSOFT CORPORATION (600718.SS) Évaluation DCF |
Entièrement Modifiable: Adapté À Vos Besoins Dans Excel Ou Sheets
Conception Professionnelle: Modèles Fiables Et Conformes Aux Normes Du Secteur
Pré-Construits Pour Une Utilisation Rapide Et Efficace
Compatible MAC/PC, entièrement débloqué
Aucune Expertise N'Est Requise; Facile À Suivre
Neusoft Corporation (600718.SS) Bundle
Conçu pour la précision, notre (600718SS) Calculator DCF vous permet d'évaluer l'évaluation de Neusoft Corporation à l'aide de données financières réelles, tout en offrant une flexibilité complète pour modifier tous les paramètres essentiels pour des projections améliorées.
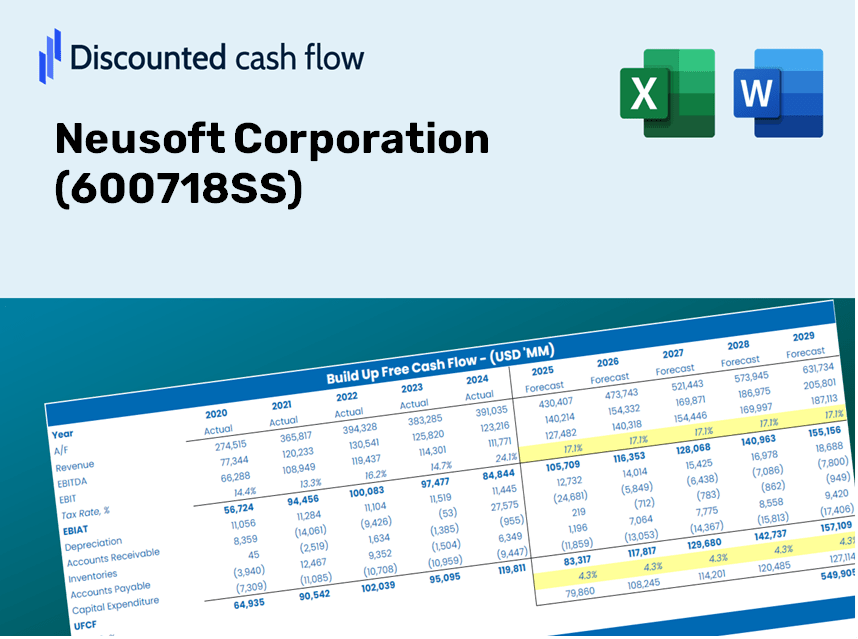
Discounted Cash Flow (DCF) - (USD MM)
| Year | AY1 2020 |
AY2 2021 |
AY3 2022 |
AY4 2023 |
AY5 2024 |
FY1 2025 |
FY2 2026 |
FY3 2027 |
FY4 2028 |
FY5 2029 |
|---|---|---|---|---|---|---|---|---|---|---|
| Revenue | 7,622.0 | 8,734.8 | 9,465.8 | 10,543.7 | 11,559.6 | 12,830.9 | 14,242.1 | 15,808.4 | 17,547.0 | 19,476.7 |
| Revenue Growth, % | 0 | 14.6 | 8.37 | 11.39 | 9.64 | 11 | 11 | 11 | 11 | 11 |
| EBITDA | 283.0 | 465.6 | 239.8 | 613.2 | 736.8 | 609.9 | 677.0 | 751.4 | 834.1 | 925.8 |
| EBITDA, % | 3.71 | 5.33 | 2.53 | 5.82 | 6.37 | 4.75 | 4.75 | 4.75 | 4.75 | 4.75 |
| Depreciation | 368.9 | 364.0 | 334.8 | 298.4 | 278.6 | 456.4 | 506.6 | 562.3 | 624.1 | 692.8 |
| Depreciation, % | 4.84 | 4.17 | 3.54 | 2.83 | 2.41 | 3.56 | 3.56 | 3.56 | 3.56 | 3.56 |
| EBIT | -85.9 | 101.6 | -95.0 | 314.8 | 458.2 | 153.5 | 170.4 | 189.1 | 209.9 | 233.0 |
| EBIT, % | -1.13 | 1.16 | -1 | 2.99 | 3.96 | 1.2 | 1.2 | 1.2 | 1.2 | 1.2 |
| Total Cash | 3,248.9 | 3,531.6 | 3,137.4 | 3,554.0 | 2,995.6 | 4,511.9 | 5,008.1 | 5,558.9 | 6,170.3 | 6,848.9 |
| Total Cash, percent | .0 | .0 | .0 | .0 | .0 | .0 | .0 | .0 | .0 | .0 |
| Account Receivables | 2,125.1 | 1,749.1 | 1,917.9 | 2,288.4 | 2,502.5 | 2,861.8 | 3,176.5 | 3,525.8 | 3,913.6 | 4,344.0 |
| Account Receivables, % | 27.88 | 20.02 | 20.26 | 21.7 | 21.65 | 22.3 | 22.3 | 22.3 | 22.3 | 22.3 |
| Inventories | 3,794.1 | 4,930.4 | 5,452.5 | 4,946.5 | 4,387.1 | 6,381.9 | 7,083.8 | 7,862.8 | 8,727.6 | 9,687.4 |
| Inventories, % | 49.78 | 56.45 | 57.6 | 46.91 | 37.95 | 49.74 | 49.74 | 49.74 | 49.74 | 49.74 |
| Accounts Payable | 1,150.8 | 1,157.6 | 1,547.5 | 1,758.8 | 1,819.7 | 1,979.1 | 2,196.8 | 2,438.4 | 2,706.5 | 3,004.2 |
| Accounts Payable, % | 15.1 | 13.25 | 16.35 | 16.68 | 15.74 | 15.42 | 15.42 | 15.42 | 15.42 | 15.42 |
| Capital Expenditure | -333.7 | -298.1 | -737.0 | -358.1 | -598.2 | -619.7 | -687.8 | -763.5 | -847.4 | -940.6 |
| Capital Expenditure, % | -4.38 | -3.41 | -7.79 | -3.4 | -5.17 | -4.83 | -4.83 | -4.83 | -4.83 | -4.83 |
| Tax Rate, % | 18.2 | 18.2 | 18.2 | 18.2 | 18.2 | 18.2 | 18.2 | 18.2 | 18.2 | 18.2 |
| EBITAT | -559.0 | 103.1 | -98.2 | 251.5 | 374.8 | 141.7 | 157.3 | 174.6 | 193.8 | 215.2 |
| Depreciation | ||||||||||
| Changes in Account Receivables | ||||||||||
| Changes in Inventories | ||||||||||
| Changes in Accounts Payable | ||||||||||
| Capital Expenditure | ||||||||||
| UFCF | -5,292.1 | -584.4 | -801.4 | 538.5 | 461.6 | -2,216.2 | -822.8 | -913.3 | -1,013.8 | -1,125.3 |
| WACC, % | 4.92 | 4.92 | 4.92 | 4.87 | 4.87 | 4.9 | 4.9 | 4.9 | 4.9 | 4.9 |
| PV UFCF | ||||||||||
| SUM PV UFCF | -5,374.4 | |||||||||
| Long Term Growth Rate, % | 3.50 | |||||||||
| Free cash flow (T + 1) | -1,165 | |||||||||
| Terminal Value | -83,004 | |||||||||
| Present Terminal Value | -65,337 | |||||||||
| Enterprise Value | -70,711 | |||||||||
| Net Debt | -1,706 | |||||||||
| Equity Value | -69,005 | |||||||||
| Diluted Shares Outstanding, MM | 1,261 | |||||||||
| Equity Value Per Share | -54.72 |
What You Will Receive
- Authentic Neusoft Data: Loaded financial details – encompassing everything from revenue to EBIT – derived from actual and forecasted figures.
- Comprehensive Customization: Modify all essential variables (yellow cells) such as WACC, growth %, and tax rates.
- Immediate Valuation Adjustments: Automatic updates to assess the influence of changes on Neusoft’s fair value.
- Flexible Excel Template: Designed for quick modifications, scenario analysis, and in-depth projections.
- Efficient and Precise: Avoid the hassle of constructing models from the ground up while ensuring accuracy and adaptability.
Key Features of Neusoft Corporation (600718SS)
- Accurate Historical Data: Gain access to reliable pre-loaded financial data and projected trends.
- Flexible Forecast Inputs: Modify highlighted fields such as WACC, growth rates, and profit margins.
- Real-Time Calculations: Automatic adjustments for DCF, Net Present Value (NPV), and cash flow assessments.
- User-Friendly Dashboard: Clear charts and summaries that make it easy to interpret your valuation results.
- Designed for All Skill Levels: An accessible and straightforward layout tailored for investors, CFOs, and consultants alike.
How It Works
- Step 1: Download the prebuilt Excel template featuring Neusoft Corporation's (600718SS) data.
- Step 2: Review the pre-filled sheets to familiarize yourself with the essential metrics.
- Step 3: Modify forecasts and assumptions in the editable yellow cells (WACC, growth, margins).
- Step 4: Immediately see the recalculated results, including Neusoft Corporation's intrinsic value.
- Step 5: Make well-informed investment decisions or create reports based on the generated outputs.
Why Choose This Calculator for Neusoft Corporation (600718SS)?
- Precision: Leveraging accurate financials from Neusoft ensures reliable data.
- Versatility: Tailored for users to effortlessly adjust and experiment with inputs.
- Efficiency: Eliminate the tedious process of constructing a DCF model from the ground up.
- High-Quality Standards: Crafted with the insight and usability expected by CFOs.
- Accessible: Designed for ease of use, catering even to those without expert financial modeling skills.
Who Should Utilize This Product?
- Individual Investors: Make well-informed choices regarding the purchase or sale of Neusoft Corporation (600718SS) stock.
- Financial Analysts: Enhance valuation workflows with comprehensive financial models at your disposal.
- Consultants: Provide clients with precise and timely valuation insights for Neusoft Corporation (600718SS).
- Business Owners: Gain insight into how major corporations like Neusoft Corporation (600718SS) are valued to inform your strategic planning.
- Finance Students: Acquire valuation skills through the analysis of real-world data and practical scenarios involving Neusoft Corporation (600718SS).
Overview of the Template Contents
- Preloaded Neusoft Data: Historical and projected financial metrics, including revenue, EBIT, and capital investments.
- DCF and WACC Models: Advanced spreadsheets for determining intrinsic value and Weighted Average Cost of Capital.
- Editable Inputs: Yellow-highlighted fields for customizing revenue growth, tax rates, and discount rates.
- Financial Statements: Detailed annual and quarterly financial reports for in-depth evaluation.
- Key Ratios: Metrics for profitability, leverage, and efficiency to assess company performance.
- Dashboard and Charts: Visual representations of valuation results and underlying assumptions.
Disclaimer
All information, articles, and product details provided on this website are for general informational and educational purposes only. We do not claim any ownership over, nor do we intend to infringe upon, any trademarks, copyrights, logos, brand names, or other intellectual property mentioned or depicted on this site. Such intellectual property remains the property of its respective owners, and any references here are made solely for identification or informational purposes, without implying any affiliation, endorsement, or partnership.
We make no representations or warranties, express or implied, regarding the accuracy, completeness, or suitability of any content or products presented. Nothing on this website should be construed as legal, tax, investment, financial, medical, or other professional advice. In addition, no part of this site—including articles or product references—constitutes a solicitation, recommendation, endorsement, advertisement, or offer to buy or sell any securities, franchises, or other financial instruments, particularly in jurisdictions where such activity would be unlawful.
All content is of a general nature and may not address the specific circumstances of any individual or entity. It is not a substitute for professional advice or services. Any actions you take based on the information provided here are strictly at your own risk. You accept full responsibility for any decisions or outcomes arising from your use of this website and agree to release us from any liability in connection with your use of, or reliance upon, the content or products found herein.