
|
PCI Technology Group Co., Ltd. (600728.SS) Évaluation DCF |
Entièrement Modifiable: Adapté À Vos Besoins Dans Excel Ou Sheets
Conception Professionnelle: Modèles Fiables Et Conformes Aux Normes Du Secteur
Pré-Construits Pour Une Utilisation Rapide Et Efficace
Compatible MAC/PC, entièrement débloqué
Aucune Expertise N'Est Requise; Facile À Suivre
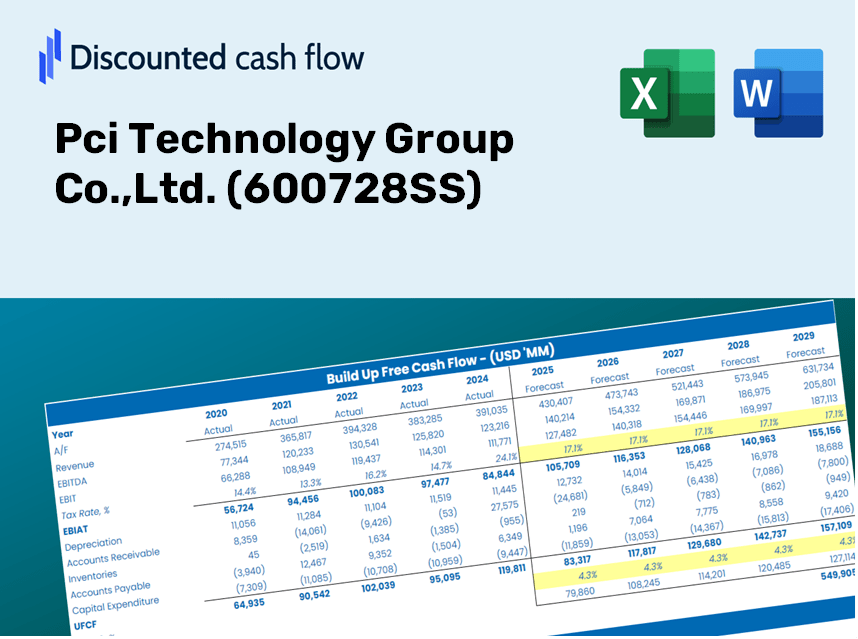
Pci Technology Group Co.,Ltd. (600728.SS) Bundle
Gagnez du temps et améliorez la précision avec notre calculatrice DCF (600728SS)! Équipé de données réelles de PCI Technology Group Co., Ltd. et d'hypothèses personnalisables, cet outil vous permet de prévoir, analyser et valoriser le groupe de technologie PCI comme un investisseur chevronné.
Discounted Cash Flow (DCF) - (USD MM)
| Year | AY1 2020 |
AY2 2021 |
AY3 2022 |
AY4 2023 |
AY5 2024 |
FY1 2025 |
FY2 2026 |
FY3 2027 |
FY4 2028 |
FY5 2029 |
|---|---|---|---|---|---|---|---|---|---|---|
| Revenue | 4,286.5 | 6,223.8 | 5,336.4 | 6,227.5 | 7,948.6 | 9,444.4 | 11,221.6 | 13,333.3 | 15,842.4 | 18,823.7 |
| Revenue Growth, % | 0 | 45.19 | -14.26 | 16.7 | 27.64 | 18.82 | 18.82 | 18.82 | 18.82 | 18.82 |
| EBITDA | 175.9 | 453.3 | 90.5 | 182.9 | -2.1 | 302.1 | 358.9 | 426.5 | 506.8 | 602.1 |
| EBITDA, % | 4.1 | 7.28 | 1.7 | 2.94 | -0.02636219 | 3.2 | 3.2 | 3.2 | 3.2 | 3.2 |
| Depreciation | 102.6 | 123.4 | 165.0 | 199.9 | 18.0 | 206.0 | 244.7 | 290.8 | 345.5 | 410.5 |
| Depreciation, % | 2.39 | 1.98 | 3.09 | 3.21 | 0.2263 | 2.18 | 2.18 | 2.18 | 2.18 | 2.18 |
| EBIT | 73.3 | 329.9 | -74.5 | -17.0 | -20.1 | 96.1 | 114.2 | 135.7 | 161.2 | 191.6 |
| EBIT, % | 1.71 | 5.3 | -1.4 | -0.27322 | -0.25267 | 1.02 | 1.02 | 1.02 | 1.02 | 1.02 |
| Total Cash | 2,546.0 | 1,525.6 | 1,225.7 | 2,056.3 | 1,949.7 | 3,105.8 | 3,690.2 | 4,384.7 | 5,209.8 | 6,190.1 |
| Total Cash, percent | .0 | .0 | .0 | .0 | .0 | .0 | .0 | .0 | .0 | .0 |
| Account Receivables | 4,323.2 | 4,660.3 | 4,597.9 | 5,128.6 | 7,005.6 | 8,151.1 | 9,685.0 | 11,507.5 | 13,673.0 | 16,246.0 |
| Account Receivables, % | 100.86 | 74.88 | 86.16 | 82.35 | 88.14 | 86.31 | 86.31 | 86.31 | 86.31 | 86.31 |
| Inventories | 581.1 | 584.1 | 817.7 | 1,059.4 | 1,664.3 | 1,439.6 | 1,710.5 | 2,032.4 | 2,414.9 | 2,869.3 |
| Inventories, % | 13.56 | 9.39 | 15.32 | 17.01 | 20.94 | 15.24 | 15.24 | 15.24 | 15.24 | 15.24 |
| Accounts Payable | 3,605.2 | 3,487.5 | 3,936.0 | 4,643.4 | 6,835.1 | 7,072.9 | 8,403.9 | 9,985.4 | 11,864.4 | 14,097.1 |
| Accounts Payable, % | 84.11 | 56.03 | 73.76 | 74.56 | 85.99 | 74.89 | 74.89 | 74.89 | 74.89 | 74.89 |
| Capital Expenditure | -334.7 | -260.9 | -197.3 | -197.6 | -175.3 | -398.1 | -473.0 | -562.0 | -667.8 | -793.5 |
| Capital Expenditure, % | -7.81 | -4.19 | -3.7 | -3.17 | -2.2 | -4.22 | -4.22 | -4.22 | -4.22 | -4.22 |
| Tax Rate, % | 15.18 | 15.18 | 15.18 | 15.18 | 15.18 | 15.18 | 15.18 | 15.18 | 15.18 | 15.18 |
| EBITAT | 93.7 | 294.2 | -55.6 | -15.1 | -17.0 | 84.0 | 99.8 | 118.6 | 141.0 | 167.5 |
| Depreciation | ||||||||||
| Changes in Account Receivables | ||||||||||
| Changes in Inventories | ||||||||||
| Changes in Accounts Payable | ||||||||||
| Capital Expenditure | ||||||||||
| UFCF | -1,437.5 | -301.3 | 189.4 | -77.6 | -464.5 | -791.1 | -602.2 | -715.6 | -850.2 | -1,010.2 |
| WACC, % | 5.17 | 5.15 | 5.12 | 5.15 | 5.14 | 5.15 | 5.15 | 5.15 | 5.15 | 5.15 |
| PV UFCF | ||||||||||
| SUM PV UFCF | -3,394.2 | |||||||||
| Long Term Growth Rate, % | 3.00 | |||||||||
| Free cash flow (T + 1) | -1,041 | |||||||||
| Terminal Value | -48,464 | |||||||||
| Present Terminal Value | -37,708 | |||||||||
| Enterprise Value | -41,102 | |||||||||
| Net Debt | -1,657 | |||||||||
| Equity Value | -39,445 | |||||||||
| Diluted Shares Outstanding, MM | 2,135 | |||||||||
| Equity Value Per Share | -18.47 |
Benefits You Will Receive
- Customized Financial Model: Leverage Pci Technology Group Co.,Ltd.'s actual data for accurate DCF valuation.
- Comprehensive Forecast Control: Modify revenue growth, profit margins, WACC, and other critical parameters.
- Real-Time Calculations: Instant updates allow you to view results immediately as you alter inputs.
- Professional-Grade Template: A polished Excel file crafted for high-quality valuation analysis.
- Flexible and Reusable: Designed for adaptability, making it ideal for ongoing detailed forecasts.
Key Features
- Live Financial Data for PCI Technology: Pre-loaded with historical financials and projections for Pci Technology Group Co.,Ltd. (600728SS).
- Customizable Input Options: Modify revenue growth rates, profit margins, WACC, tax rates, and capital expenditures to suit your analysis.
- Interactive Valuation Model: Automatically refreshes Net Present Value (NPV) and intrinsic value based on your specified parameters.
- Comprehensive Scenario Analysis: Generate various forecasting scenarios to explore different valuation possibilities.
- Intuitive User Interface: Designed for ease of use, making it accessible for both experienced professionals and newcomers.
How It Works
- Step 1: Download the Excel file.
- Step 2: Review the pre-filled data for Pci Technology Group Co.,Ltd. (600728SS), including historical figures and forecasts.
- Step 3: Modify the key assumptions (highlighted in yellow) based on your assessment.
- Step 4: Check the updated calculations for Pci Technology Group Co.,Ltd.'s intrinsic value.
- Step 5: Utilize the results for your investment analysis or reporting needs.
Why Opt for Pci Technology Group's Calculator?
- All-in-One Solution: Combines DCF, WACC, and financial ratio assessments in a single interface.
- Flexible Inputs: Modify the highlighted cells to explore different scenarios.
- In-Depth Analysis: Automatically computes the intrinsic value and Net Present Value for Pci Technology Group (600728SS).
- Pre-Loaded Information: Access to historical and projected data ensures a reliable foundation.
- High-Quality Standards: Perfect for financial analysts, investors, and business consultants alike.
Who Can Benefit from Our Solutions?
- Investors: Empower your investment strategies with our advanced valuation tools.
- Financial Analysts: Streamline your workflow with our customizable DCF model at your fingertips.
- Consultants: Effortlessly modify our templates for impactful client presentations and reports.
- Finance Enthusiasts: Enhance your knowledge of valuation methods through practical, real-world applications.
- Educators and Students: Utilize our resources as a valuable asset for finance education and practical learning.
Contents of the Template
- Pre-Populated Information: Features historical financial data and projections for Pci Technology Group Co.,Ltd. (600728SS).
- Discounted Cash Flow Model: An editable DCF valuation model with automated calculations for convenience.
- Weighted Average Cost of Capital (WACC): A specialized sheet for WACC calculation using user-defined inputs.
- Essential Financial Ratios: Evaluate Pci Technology Group Co.,Ltd.'s profitability, efficiency, and leverage metrics.
- Customizable Inputs: Easily modify revenue growth rates, profit margins, and tax percentages.
- User-Friendly Dashboard: Visuals and tables that encapsulate vital valuation findings.
Disclaimer
All information, articles, and product details provided on this website are for general informational and educational purposes only. We do not claim any ownership over, nor do we intend to infringe upon, any trademarks, copyrights, logos, brand names, or other intellectual property mentioned or depicted on this site. Such intellectual property remains the property of its respective owners, and any references here are made solely for identification or informational purposes, without implying any affiliation, endorsement, or partnership.
We make no representations or warranties, express or implied, regarding the accuracy, completeness, or suitability of any content or products presented. Nothing on this website should be construed as legal, tax, investment, financial, medical, or other professional advice. In addition, no part of this site—including articles or product references—constitutes a solicitation, recommendation, endorsement, advertisement, or offer to buy or sell any securities, franchises, or other financial instruments, particularly in jurisdictions where such activity would be unlawful.
All content is of a general nature and may not address the specific circumstances of any individual or entity. It is not a substitute for professional advice or services. Any actions you take based on the information provided here are strictly at your own risk. You accept full responsibility for any decisions or outcomes arising from your use of this website and agree to release us from any liability in connection with your use of, or reliance upon, the content or products found herein.