
|
Shanghai Material Trading Co., Ltd. (600822.SS) Évaluation DCF |
Entièrement Modifiable: Adapté À Vos Besoins Dans Excel Ou Sheets
Conception Professionnelle: Modèles Fiables Et Conformes Aux Normes Du Secteur
Pré-Construits Pour Une Utilisation Rapide Et Efficace
Compatible MAC/PC, entièrement débloqué
Aucune Expertise N'Est Requise; Facile À Suivre
Shanghai Material Trading Co., Ltd. (600822.SS) Bundle
Vous cherchez à évaluer la valeur intrinsèque de Shanghai Material Trading Co., Ltd.? Notre calculatrice DCF (600822SS) intègre des données du monde réel avec des fonctionnalités de personnalisation complètes, vous permettant d'affiner vos prévisions et d'améliorer vos décisions d'investissement.
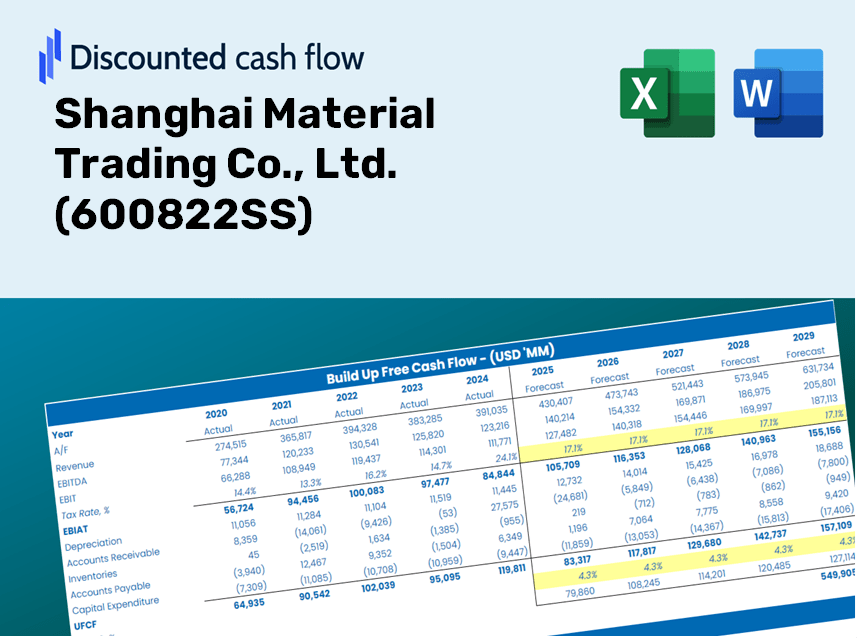
Discounted Cash Flow (DCF) - (USD MM)
| Year | AY1 2020 |
AY2 2021 |
AY3 2022 |
AY4 2023 |
AY5 2024 |
FY1 2025 |
FY2 2026 |
FY3 2027 |
FY4 2028 |
FY5 2029 |
|---|---|---|---|---|---|---|---|---|---|---|
| Revenue | 7,855.7 | 6,566.8 | 5,022.1 | 7,866.9 | 4,516.7 | 4,224.6 | 3,951.4 | 3,695.8 | 3,456.8 | 3,233.2 |
| Revenue Growth, % | 0 | -16.41 | -23.52 | 56.65 | -42.59 | -6.47 | -6.47 | -6.47 | -6.47 | -6.47 |
| EBITDA | 178.5 | 251.7 | 140.6 | 288.6 | 118.1 | 128.3 | 120.0 | 112.3 | 105.0 | 98.2 |
| EBITDA, % | 2.27 | 3.83 | 2.8 | 3.67 | 2.61 | 3.04 | 3.04 | 3.04 | 3.04 | 3.04 |
| Depreciation | 46.8 | 74.4 | 78.4 | 80.4 | 55.7 | 46.9 | 43.8 | 41.0 | 38.3 | 35.9 |
| Depreciation, % | 0.59616 | 1.13 | 1.56 | 1.02 | 1.23 | 1.11 | 1.11 | 1.11 | 1.11 | 1.11 |
| EBIT | 131.7 | 177.3 | 62.1 | 208.2 | 62.4 | 81.5 | 76.2 | 71.3 | 66.7 | 62.3 |
| EBIT, % | 1.68 | 2.7 | 1.24 | 2.65 | 1.38 | 1.93 | 1.93 | 1.93 | 1.93 | 1.93 |
| Total Cash | 889.2 | 739.7 | 742.6 | 1,040.3 | 1,145.3 | 641.7 | 600.2 | 561.4 | 525.1 | 491.1 |
| Total Cash, percent | .0 | .0 | .0 | .0 | .0 | .0 | .0 | .0 | .0 | .0 |
| Account Receivables | 90.3 | 124.6 | 156.3 | 286.3 | 194.1 | 119.1 | 111.4 | 104.2 | 97.4 | 91.1 |
| Account Receivables, % | 1.15 | 1.9 | 3.11 | 3.64 | 4.3 | 2.82 | 2.82 | 2.82 | 2.82 | 2.82 |
| Inventories | 330.4 | 223.6 | 1,538.0 | 1,199.0 | 234.9 | 495.8 | 463.7 | 433.7 | 405.7 | 379.4 |
| Inventories, % | 4.21 | 3.41 | 30.63 | 15.24 | 5.2 | 11.74 | 11.74 | 11.74 | 11.74 | 11.74 |
| Accounts Payable | 887.9 | 327.4 | 1,700.7 | 1,420.0 | 317.4 | 635.6 | 594.5 | 556.1 | 520.1 | 486.5 |
| Accounts Payable, % | 11.3 | 4.99 | 33.86 | 18.05 | 7.03 | 15.05 | 15.05 | 15.05 | 15.05 | 15.05 |
| Capital Expenditure | -6.6 | -29.4 | -18.6 | -23.3 | -23.5 | -14.5 | -13.6 | -12.7 | -11.9 | -11.1 |
| Capital Expenditure, % | -0.08443517 | -0.44746 | -0.36989 | -0.296 | -0.52106 | -0.34377 | -0.34377 | -0.34377 | -0.34377 | -0.34377 |
| Tax Rate, % | 4.91 | 4.91 | 4.91 | 4.91 | 4.91 | 4.91 | 4.91 | 4.91 | 4.91 | 4.91 |
| EBITAT | 107.3 | 143.3 | 59.0 | 143.8 | 59.3 | 68.7 | 64.2 | 60.1 | 56.2 | 52.5 |
| Depreciation | ||||||||||
| Changes in Account Receivables | ||||||||||
| Changes in Inventories | ||||||||||
| Changes in Accounts Payable | ||||||||||
| Capital Expenditure | ||||||||||
| UFCF | 614.7 | -299.6 | 146.0 | 129.3 | 45.1 | 233.4 | 93.1 | 87.1 | 81.5 | 76.2 |
| WACC, % | 7.38 | 7.37 | 7.4 | 7.35 | 7.4 | 7.38 | 7.38 | 7.38 | 7.38 | 7.38 |
| PV UFCF | ||||||||||
| SUM PV UFCF | 483.1 | |||||||||
| Long Term Growth Rate, % | 2.00 | |||||||||
| Free cash flow (T + 1) | 78 | |||||||||
| Terminal Value | 1,444 | |||||||||
| Present Terminal Value | 1,012 | |||||||||
| Enterprise Value | 1,495 | |||||||||
| Net Debt | -970 | |||||||||
| Equity Value | 2,465 | |||||||||
| Diluted Shares Outstanding, MM | 505 | |||||||||
| Equity Value Per Share | 4.88 |
What You Will Receive
- Authentic Shanghai Material Data: Preloaded financial metrics – encompassing everything from revenue to EBIT – derived from actual and projected information.
- Comprehensive Customization: Modify all essential parameters (highlighted cells) such as WACC, growth %, and tax rates.
- Immediate Valuation Adjustments: Automatic recalculations to evaluate the effects of changes on Shanghai Material Trading Co., Ltd.'s fair value.
- Flexible Excel Template: Designed for quick modifications, scenario analysis, and in-depth forecasts.
- Efficient and Precise: Avoid constructing models from the ground up while ensuring accuracy and adaptability.
Key Features
- Comprehensive Market Data: Pre-loaded with Shanghai Material Trading Co., Ltd.’s historical trading metrics and future forecasts.
- Fully Adjustable Parameters: Tailor inputs for revenue growth, profit margins, discount rates, tax liabilities, and capital investments.
- Interactive Valuation Model: Instant updates to Net Present Value (NPV) and intrinsic value based on your customized parameters.
- Scenario Analysis: Develop various forecast scenarios to evaluate different valuation possibilities.
- User-Friendly Interface: Intuitive and organized design suitable for both industry experts and newcomers.
How It Functions
- 1. Access the Template: Download and open the Excel file containing Shanghai Material Trading Co., Ltd.’s (600822SS) preloaded data.
- 2. Adjust Key Inputs: Modify essential parameters such as growth projections, WACC, and capital expenditures.
- 3. Instantly View Outcomes: The DCF model automatically computes intrinsic value and NPV in real-time.
- 4. Explore Different Scenarios: Analyze various forecasts to evaluate diverse valuation results.
- 5. Present with Assurance: Deliver professional valuation insights to enhance your decision-making process.
Why Choose Shanghai Material Trading Co., Ltd. (600822SS)?
- User-Friendly Interface: Perfectly crafted for both novices and seasoned professionals.
- Customizable Parameters: Modify inputs effortlessly to suit your analysis needs.
- Real-Time Insights: Observe immediate changes to valuation metrics as you adjust your inputs.
- Pre-Configured: Comes with Shanghai Material Trading Co.’s latest financial data for swift evaluations.
- Relied Upon by Experts: Utilized by investors and analysts for making well-informed choices.
Who Can Benefit from Our Services?
- Investors: Gain the confidence to make informed decisions with our top-notch trading insights.
- Market Analysts: Streamline your analysis with customized reports tailored to your needs.
- Consultants: Effortlessly modify our templates for client meetings or detailed presentations.
- Trade Enthusiasts: Enhance your knowledge of trading strategies through real-life case studies.
- Educators and Students: Utilize our resources as a hands-on learning asset in trading and finance courses.
Contents of the Template
- Historical Data: Comprehensive overview of Shanghai Material Trading Co., Ltd.'s past financial performance and baseline projections.
- DCF and Levered DCF Models: In-depth templates designed to assess the intrinsic value of Shanghai Material Trading Co., Ltd. (600822SS).
- WACC Sheet: Pre-configured calculations for the Weighted Average Cost of Capital.
- Editable Inputs: Customize essential factors such as growth rates, EBITDA percentages, and capital expenditure assumptions.
- Quarterly and Annual Statements: A thorough breakdown of Shanghai Material Trading Co., Ltd.'s financial statements.
- Interactive Dashboard: Dynamically visualize valuation outcomes and forecasts.
Disclaimer
All information, articles, and product details provided on this website are for general informational and educational purposes only. We do not claim any ownership over, nor do we intend to infringe upon, any trademarks, copyrights, logos, brand names, or other intellectual property mentioned or depicted on this site. Such intellectual property remains the property of its respective owners, and any references here are made solely for identification or informational purposes, without implying any affiliation, endorsement, or partnership.
We make no representations or warranties, express or implied, regarding the accuracy, completeness, or suitability of any content or products presented. Nothing on this website should be construed as legal, tax, investment, financial, medical, or other professional advice. In addition, no part of this site—including articles or product references—constitutes a solicitation, recommendation, endorsement, advertisement, or offer to buy or sell any securities, franchises, or other financial instruments, particularly in jurisdictions where such activity would be unlawful.
All content is of a general nature and may not address the specific circumstances of any individual or entity. It is not a substitute for professional advice or services. Any actions you take based on the information provided here are strictly at your own risk. You accept full responsibility for any decisions or outcomes arising from your use of this website and agree to release us from any liability in connection with your use of, or reliance upon, the content or products found herein.