
|
CETC Digital Technology Co., Ltd. (600850.SS) Évaluation DCF |
Entièrement Modifiable: Adapté À Vos Besoins Dans Excel Ou Sheets
Conception Professionnelle: Modèles Fiables Et Conformes Aux Normes Du Secteur
Pré-Construits Pour Une Utilisation Rapide Et Efficace
Compatible MAC/PC, entièrement débloqué
Aucune Expertise N'Est Requise; Facile À Suivre
CETC Digital Technology Co.,Ltd. (600850.SS) Bundle
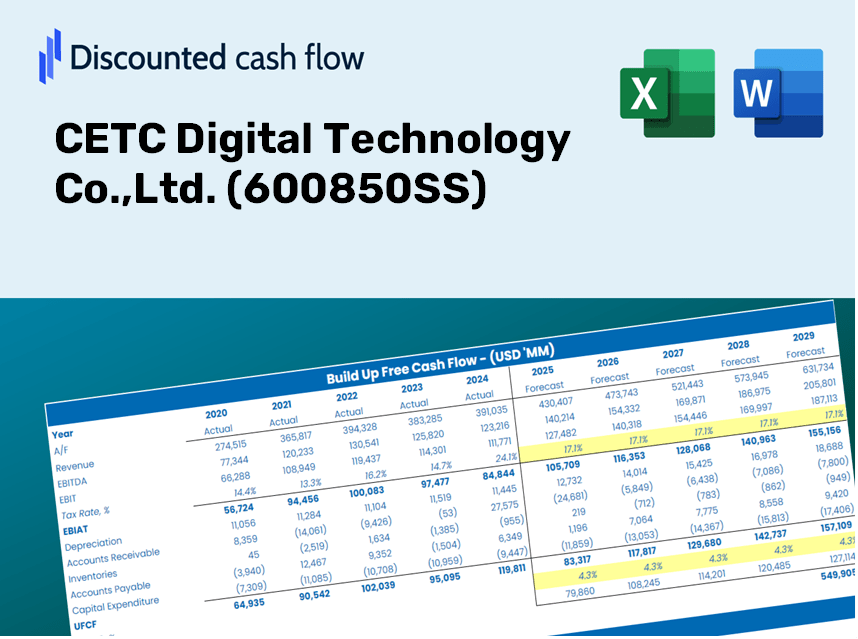
Gardez un aperçu de votre analyse d'évaluation de votre CETC Digital Technology Co., Ltd. (600850SS) avec notre calculatrice DCF de pointe! Préchargé avec des données authentiques (600850SS), ce modèle Excel vous permet d'ajuster les prévisions et les hypothèses pour déterminer la valeur intrinsèque de CETC Digital Technology Co., Ltd. avec précision.
Discounted Cash Flow (DCF) - (USD MM)
| Year | AY1 2020 |
AY2 2021 |
AY3 2022 |
AY4 2023 |
AY5 2024 |
FY1 2025 |
FY2 2026 |
FY3 2027 |
FY4 2028 |
FY5 2029 |
|---|---|---|---|---|---|---|---|---|---|---|
| Revenue | 8,129.6 | 8,961.8 | 9,871.5 | 10,000.9 | 10,679.2 | 11,439.5 | 12,254.0 | 13,126.5 | 14,061.1 | 15,062.3 |
| Revenue Growth, % | 0 | 10.24 | 10.15 | 1.31 | 6.78 | 7.12 | 7.12 | 7.12 | 7.12 | 7.12 |
| EBITDA | 396.9 | 649.8 | 699.9 | 720.8 | 759.0 | 767.3 | 821.9 | 880.5 | 943.2 | 1,010.3 |
| EBITDA, % | 4.88 | 7.25 | 7.09 | 7.21 | 7.11 | 6.71 | 6.71 | 6.71 | 6.71 | 6.71 |
| Depreciation | 28.9 | 98.2 | 123.2 | 137.1 | 140.3 | 123.2 | 131.9 | 141.3 | 151.4 | 162.2 |
| Depreciation, % | 0.35535 | 1.1 | 1.25 | 1.37 | 1.31 | 1.08 | 1.08 | 1.08 | 1.08 | 1.08 |
| EBIT | 368.0 | 551.6 | 576.7 | 583.7 | 618.7 | 644.1 | 690.0 | 739.1 | 791.8 | 848.1 |
| EBIT, % | 4.53 | 6.16 | 5.84 | 5.84 | 5.79 | 5.63 | 5.63 | 5.63 | 5.63 | 5.63 |
| Total Cash | 2,527.2 | 3,181.7 | 2,924.2 | 2,721.8 | 2,190.7 | 3,293.2 | 3,527.7 | 3,778.9 | 4,048.0 | 4,336.2 |
| Total Cash, percent | .0 | .0 | .0 | .0 | .0 | .0 | .0 | .0 | .0 | .0 |
| Account Receivables | 1,763.6 | 2,395.7 | 2,944.1 | 3,150.7 | 3,699.8 | 3,303.7 | 3,538.9 | 3,790.9 | 4,060.8 | 4,350.0 |
| Account Receivables, % | 21.69 | 26.73 | 29.82 | 31.5 | 34.64 | 28.88 | 28.88 | 28.88 | 28.88 | 28.88 |
| Inventories | 2,936.3 | 3,624.8 | 3,758.2 | 3,613.3 | 3,979.1 | 4,301.9 | 4,608.2 | 4,936.3 | 5,287.7 | 5,664.2 |
| Inventories, % | 36.12 | 40.45 | 38.07 | 36.13 | 37.26 | 37.61 | 37.61 | 37.61 | 37.61 | 37.61 |
| Accounts Payable | 1,702.8 | 1,745.7 | 2,201.7 | 2,119.8 | 1,598.4 | 2,262.5 | 2,423.6 | 2,596.2 | 2,781.1 | 2,979.1 |
| Accounts Payable, % | 20.95 | 19.48 | 22.3 | 21.2 | 14.97 | 19.78 | 19.78 | 19.78 | 19.78 | 19.78 |
| Capital Expenditure | -31.5 | -115.5 | -94.5 | -118.4 | -134.9 | -116.2 | -124.5 | -133.4 | -142.9 | -153.0 |
| Capital Expenditure, % | -0.38731 | -1.29 | -0.95719 | -1.18 | -1.26 | -1.02 | -1.02 | -1.02 | -1.02 | -1.02 |
| Tax Rate, % | 6.59 | 6.59 | 6.59 | 6.59 | 6.59 | 6.59 | 6.59 | 6.59 | 6.59 | 6.59 |
| EBITAT | 316.2 | 408.5 | 528.0 | 508.4 | 577.9 | 556.6 | 596.2 | 638.7 | 684.1 | 732.8 |
| Depreciation | ||||||||||
| Changes in Account Receivables | ||||||||||
| Changes in Inventories | ||||||||||
| Changes in Accounts Payable | ||||||||||
| Capital Expenditure | ||||||||||
| UFCF | -2,683.5 | -886.4 | 330.9 | 383.5 | -852.9 | 1,301.0 | 223.2 | 239.1 | 256.2 | 274.4 |
| WACC, % | 5.49 | 5.47 | 5.5 | 5.49 | 5.5 | 5.49 | 5.49 | 5.49 | 5.49 | 5.49 |
| PV UFCF | ||||||||||
| SUM PV UFCF | 2,054.6 | |||||||||
| Long Term Growth Rate, % | 2.00 | |||||||||
| Free cash flow (T + 1) | 280 | |||||||||
| Terminal Value | 8,024 | |||||||||
| Present Terminal Value | 6,143 | |||||||||
| Enterprise Value | 8,198 | |||||||||
| Net Debt | -1,351 | |||||||||
| Equity Value | 9,549 | |||||||||
| Diluted Shares Outstanding, MM | 688 | |||||||||
| Equity Value Per Share | 13.88 |
What You Will Receive
- Authentic CETC Financial Data: Pre-populated with CETC Digital Technology’s historical and projected financials for accurate analysis.
- Customizable Template: Easily adjust crucial inputs such as revenue growth, WACC, and EBITDA margin.
- Real-Time Calculations: Instantly view updates to CETC’s intrinsic value as you modify inputs.
- Expert Valuation Tool: Tailored for investors, analysts, and consultants in search of reliable DCF results.
- Intuitive Design: Streamlined layout and straightforward instructions suitable for all skill levels.
Key Features
- Pre-Loaded Data: Historical financial statements and pre-filled forecasts for CETC Digital Technology Co., Ltd. (600850SS).
- Fully Adjustable Inputs: Customize WACC, tax rates, revenue growth, and EBITDA margins to fit your analysis needs.
- Instant Results: Watch how CETC Digital Technology's intrinsic value updates in real time.
- Clear Visual Outputs: Interactive dashboard charts present valuation results and essential metrics.
- Built for Accuracy: A reliable tool designed for analysts, investors, and finance professionals.
How It Functions
- Download: Obtain the pre-configured Excel spreadsheet featuring CETC Digital Technology Co., Ltd.’s (600850SS) financial data.
- Customize: Modify projections such as revenue growth, EBITDA percentage, and WACC to fit your analysis.
- Update Automatically: The intrinsic value and NPV calculations refresh in real-time for accurate assessments.
- Test Scenarios: Develop various projections and swiftly compare results side by side.
- Make Decisions: Leverage the valuation findings to inform your investment strategies.
Why Choose CETC Digital Technology Co., Ltd. (600850SS)?
- Precision: Utilize authentic CETC financial data for reliable insights.
- Adaptability: Built to allow users to freely experiment with and adjust inputs.
- Efficiency: Avoid the complications of creating a financial model from the ground up.
- Expert-Level: Crafted with the accuracy and functionality expected at the CFO level.
- Intuitive: Simple to navigate, suitable for all users, regardless of financial modeling expertise.
Who Should Consider Using CETC Digital Technology Co., Ltd. (600850SS)?
- Investors: Evaluate the fair value of CETC Digital Technology Co., Ltd. (600850SS) to make informed investment choices.
- CFOs: Utilize a robust DCF model for enhanced financial reporting and analysis of CETC Digital Technology Co., Ltd. (600850SS).
- Consultants: Easily customize the template for valuation reports tailored to clients interested in CETC Digital Technology Co., Ltd. (600850SS).
- Entrepreneurs: Discover financial modeling practices adopted by leading companies, including CETC Digital Technology Co., Ltd. (600850SS).
- Educators: Employ it as a resource to illustrate various valuation techniques related to CETC Digital Technology Co., Ltd. (600850SS).
Contents of the Template
- Pre-Filled Data: Contains CETC Digital Technology Co., Ltd.'s historical financials and projections.
- Discounted Cash Flow Model: Customizable DCF valuation model with automated calculations.
- Weighted Average Cost of Capital (WACC): A specific sheet for calculating WACC based on user-defined inputs.
- Key Financial Ratios: Examine CETC Digital Technology's profitability, efficiency, and leverage metrics.
- Customizable Inputs: Easily modify revenue growth, profit margins, and tax rates.
- Intuitive Dashboard: Visuals and tables presenting essential valuation outcomes.
Disclaimer
All information, articles, and product details provided on this website are for general informational and educational purposes only. We do not claim any ownership over, nor do we intend to infringe upon, any trademarks, copyrights, logos, brand names, or other intellectual property mentioned or depicted on this site. Such intellectual property remains the property of its respective owners, and any references here are made solely for identification or informational purposes, without implying any affiliation, endorsement, or partnership.
We make no representations or warranties, express or implied, regarding the accuracy, completeness, or suitability of any content or products presented. Nothing on this website should be construed as legal, tax, investment, financial, medical, or other professional advice. In addition, no part of this site—including articles or product references—constitutes a solicitation, recommendation, endorsement, advertisement, or offer to buy or sell any securities, franchises, or other financial instruments, particularly in jurisdictions where such activity would be unlawful.
All content is of a general nature and may not address the specific circumstances of any individual or entity. It is not a substitute for professional advice or services. Any actions you take based on the information provided here are strictly at your own risk. You accept full responsibility for any decisions or outcomes arising from your use of this website and agree to release us from any liability in connection with your use of, or reliance upon, the content or products found herein.