
|
Shanghai Haixin Group Co., Ltd. (600851.SS) Évaluation DCF |
Entièrement Modifiable: Adapté À Vos Besoins Dans Excel Ou Sheets
Conception Professionnelle: Modèles Fiables Et Conformes Aux Normes Du Secteur
Pré-Construits Pour Une Utilisation Rapide Et Efficace
Compatible MAC/PC, entièrement débloqué
Aucune Expertise N'Est Requise; Facile À Suivre
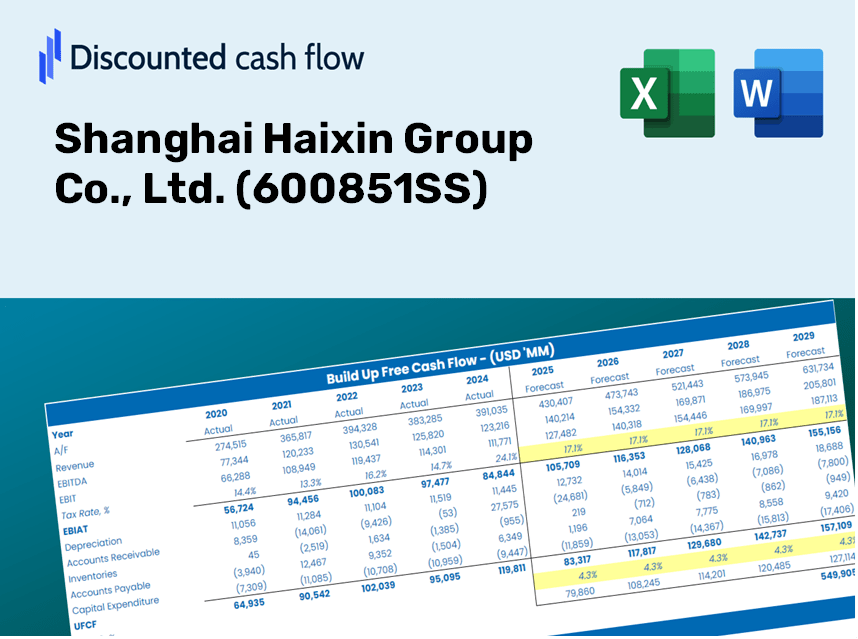
Shanghai Haixin Group Co., Ltd. (600851.SS) Bundle
Optimisez votre temps et améliorez la précision avec notre calculatrice DCF (600851SS)! En utilisant de vraies données de Shanghai Haixin Group Co., Ltd. et des hypothèses personnalisables, cet outil vous permet de prévoir, analyser et valoriser le groupe Shanghai Haixin comme un investisseur chevronné.
Discounted Cash Flow (DCF) - (USD MM)
| Year | AY1 2020 |
AY2 2021 |
AY3 2022 |
AY4 2023 |
AY5 2024 |
FY1 2025 |
FY2 2026 |
FY3 2027 |
FY4 2028 |
FY5 2029 |
|---|---|---|---|---|---|---|---|---|---|---|
| Revenue | 932.7 | 1,511.3 | 1,440.1 | 1,182.6 | 795.9 | 809.3 | 822.9 | 836.8 | 850.9 | 865.2 |
| Revenue Growth, % | 0 | 62.03 | -4.71 | -17.88 | -32.7 | 1.68 | 1.68 | 1.68 | 1.68 | 1.68 |
| EBITDA | 138.4 | 136.7 | 258.3 | 119.1 | 96.5 | 103.6 | 105.4 | 107.1 | 108.9 | 110.8 |
| EBITDA, % | 14.84 | 9.05 | 17.94 | 10.07 | 12.12 | 12.8 | 12.8 | 12.8 | 12.8 | 12.8 |
| Depreciation | 29.0 | 28.1 | 26.6 | 24.3 | 22.9 | 19.0 | 19.3 | 19.6 | 20.0 | 20.3 |
| Depreciation, % | 3.11 | 1.86 | 1.85 | 2.05 | 2.88 | 2.35 | 2.35 | 2.35 | 2.35 | 2.35 |
| EBIT | 109.5 | 108.6 | 231.7 | 94.9 | 73.6 | 84.6 | 86.1 | 87.5 | 89.0 | 90.5 |
| EBIT, % | 11.73 | 7.19 | 16.09 | 8.02 | 9.25 | 10.46 | 10.46 | 10.46 | 10.46 | 10.46 |
| Total Cash | 523.6 | 560.6 | 715.3 | 709.6 | 769.6 | 484.9 | 493.1 | 501.4 | 509.8 | 518.4 |
| Total Cash, percent | .0 | .0 | .0 | .0 | .0 | .0 | .0 | .0 | .0 | .0 |
| Account Receivables | 175.9 | 182.5 | 210.7 | 138.7 | 124.6 | 118.1 | 120.1 | 122.1 | 124.1 | 126.2 |
| Account Receivables, % | 18.86 | 12.08 | 14.63 | 11.72 | 15.66 | 14.59 | 14.59 | 14.59 | 14.59 | 14.59 |
| Inventories | 112.2 | 96.7 | 89.5 | 85.3 | 71.8 | 66.2 | 67.3 | 68.4 | 69.6 | 70.7 |
| Inventories, % | 12.03 | 6.4 | 6.22 | 7.21 | 9.02 | 8.18 | 8.18 | 8.18 | 8.18 | 8.18 |
| Accounts Payable | 99.2 | 86.1 | 77.9 | 39.6 | 31.0 | 46.9 | 47.7 | 48.5 | 49.3 | 50.2 |
| Accounts Payable, % | 10.64 | 5.7 | 5.41 | 3.35 | 3.9 | 5.8 | 5.8 | 5.8 | 5.8 | 5.8 |
| Capital Expenditure | -154.9 | -74.0 | -15.9 | -61.8 | -29.7 | -51.1 | -51.9 | -52.8 | -53.7 | -54.6 |
| Capital Expenditure, % | -16.6 | -4.9 | -1.11 | -5.22 | -3.73 | -6.31 | -6.31 | -6.31 | -6.31 | -6.31 |
| Tax Rate, % | 15.91 | 15.91 | 15.91 | 15.91 | 15.91 | 15.91 | 15.91 | 15.91 | 15.91 | 15.91 |
| EBITAT | 124.0 | 98.1 | 165.0 | 76.0 | 61.9 | 72.1 | 73.3 | 74.5 | 75.8 | 77.0 |
| Depreciation | ||||||||||
| Changes in Account Receivables | ||||||||||
| Changes in Inventories | ||||||||||
| Changes in Accounts Payable | ||||||||||
| Capital Expenditure | ||||||||||
| UFCF | -190.8 | 48.0 | 146.5 | 76.5 | 74.0 | 68.1 | 38.3 | 39.0 | 39.6 | 40.3 |
| WACC, % | 9.04 | 9.04 | 9.04 | 9.04 | 9.04 | 9.04 | 9.04 | 9.04 | 9.04 | 9.04 |
| PV UFCF | ||||||||||
| SUM PV UFCF | 178.9 | |||||||||
| Long Term Growth Rate, % | 4.00 | |||||||||
| Free cash flow (T + 1) | 42 | |||||||||
| Terminal Value | 832 | |||||||||
| Present Terminal Value | 540 | |||||||||
| Enterprise Value | 719 | |||||||||
| Net Debt | -464 | |||||||||
| Equity Value | 1,183 | |||||||||
| Diluted Shares Outstanding, MM | 1,207 | |||||||||
| Equity Value Per Share | 0.98 |
Benefits You Will Receive
- Customizable Excel Template: An adaptable Excel-based DCF Calculator featuring pre-filled financial data for Shanghai Haixin Group Co., Ltd. (600851SS).
- Comprehensive Data: Access to historical financial data and forward-looking projections (highlighted in the yellow cells).
- Adjustable Forecasts: Modify key assumptions such as revenue growth, EBITDA margins, and WACC.
- Instant Calculations: Quickly observe how your inputs affect the valuation of Shanghai Haixin Group Co., Ltd. (600851SS).
- Professional-Grade Tool: Designed for use by investors, CFOs, consultants, and financial analysts.
- Easy-to-Use Interface: Organized for straightforward navigation and clarity, complete with step-by-step guidance.
Key Features
- Real-Time SHX Data: Pre-loaded with Shanghai Haixin Group’s historical financial data and future projections.
- Comprehensive Customization: Modify inputs such as revenue growth, profit margins, WACC, tax rates, and capital expenditures.
- Dynamic Valuation Framework: Automatic recalculations of Net Present Value (NPV) and intrinsic value based on your adjustments.
- Scenario Analysis: Develop various forecast scenarios to explore different valuation possibilities.
- User-Centric Interface: Intuitive and organized, catering to both experienced professionals and newcomers.
How It Works
- Step 1: Download the Excel file.
- Step 2: Review pre-filled data for Shanghai Haixin Group Co., Ltd. (600851SS) (historical and projected).
- Step 3: Modify key assumptions (highlighted in yellow) according to your analysis.
- Step 4: Observe automatic updates reflecting Shanghai Haixin Group Co., Ltd. (600851SS)'s intrinsic value.
- Step 5: Utilize the results for your investment decisions or reporting needs.
Why Opt for This Calculator?
- Reliable Data: Accurate financial information from Shanghai Haixin Group Co., Ltd. ensures trustworthy valuation outcomes.
- Tailorable: Modify essential variables like growth rates, WACC, and tax rates to align with your forecasts.
- Efficiency: Built-in calculations save you the hassle of starting from the ground up.
- Expert-Quality Tool: Crafted for investors, analysts, and consultants alike.
- Easy to Use: User-friendly design and clear, step-by-step guidance cater to users of all skill levels.
Who Should Consider This Product?
- Investors: Evaluate Shanghai Haixin Group Co., Ltd.’s (600851SS) market position before making investment decisions.
- CFOs and Financial Analysts: Optimize valuation workflows and assess financial forecasts for (600851SS).
- Startup Founders: Gain insights into the valuation methods used for established firms like Shanghai Haixin Group Co., Ltd. (600851SS).
- Consultants: Create comprehensive valuation reports tailored for clients based on (600851SS) data.
- Students and Educators: Utilize real-time market information to learn and teach valuation methodologies relevant to (600851SS).
Contents of the Template
- Pre-Filled Data: Contains Shanghai Haixin Group Co., Ltd.’s historical financials and projections.
- Discounted Cash Flow Model: An editable DCF valuation model featuring automatic calculations.
- Weighted Average Cost of Capital (WACC): A dedicated worksheet for computing WACC using custom inputs.
- Key Financial Ratios: Examine Shanghai Haixin Group Co., Ltd.’s profitability, efficiency, and leverage metrics.
- Customizable Inputs: Easily adjust revenue growth, profit margins, and tax rates.
- Intuitive Dashboard: Visual representation of key valuation outcomes through charts and tables.
Disclaimer
All information, articles, and product details provided on this website are for general informational and educational purposes only. We do not claim any ownership over, nor do we intend to infringe upon, any trademarks, copyrights, logos, brand names, or other intellectual property mentioned or depicted on this site. Such intellectual property remains the property of its respective owners, and any references here are made solely for identification or informational purposes, without implying any affiliation, endorsement, or partnership.
We make no representations or warranties, express or implied, regarding the accuracy, completeness, or suitability of any content or products presented. Nothing on this website should be construed as legal, tax, investment, financial, medical, or other professional advice. In addition, no part of this site—including articles or product references—constitutes a solicitation, recommendation, endorsement, advertisement, or offer to buy or sell any securities, franchises, or other financial instruments, particularly in jurisdictions where such activity would be unlawful.
All content is of a general nature and may not address the specific circumstances of any individual or entity. It is not a substitute for professional advice or services. Any actions you take based on the information provided here are strictly at your own risk. You accept full responsibility for any decisions or outcomes arising from your use of this website and agree to release us from any liability in connection with your use of, or reliance upon, the content or products found herein.