
|
Ningbo Shanshan Co., Ltd. (600884.SS) Évaluation DCF |
Entièrement Modifiable: Adapté À Vos Besoins Dans Excel Ou Sheets
Conception Professionnelle: Modèles Fiables Et Conformes Aux Normes Du Secteur
Pré-Construits Pour Une Utilisation Rapide Et Efficace
Compatible MAC/PC, entièrement débloqué
Aucune Expertise N'Est Requise; Facile À Suivre
Ningbo Shanshan Co.,Ltd. (600884.SS) Bundle
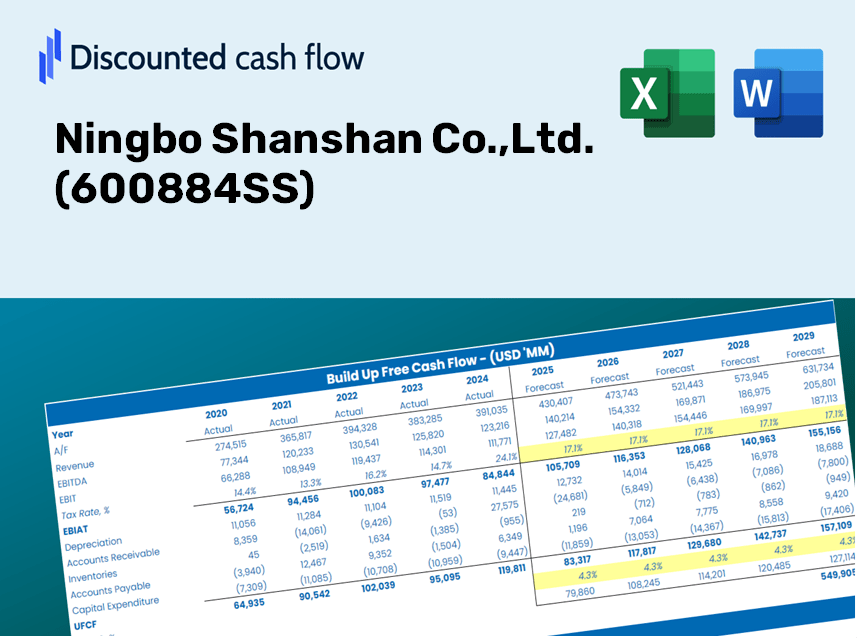
Gardez un aperçu de votre analyse d'évaluation de votre Ningbo Shanshan Co., Ltd. (600884SS) avec notre calculatrice DCF de pointe! Préchargé avec des données réelles (600884SS), ce modèle Excel vous permet d'ajuster les prévisions et les hypothèses pour déterminer avec précision la valeur intrinsèque de Ningbo Shanshan Co., Ltd.
Discounted Cash Flow (DCF) - (USD MM)
| Year | AY1 2020 |
AY2 2021 |
AY3 2022 |
AY4 2023 |
AY5 2024 |
FY1 2025 |
FY2 2026 |
FY3 2027 |
FY4 2028 |
FY5 2029 |
|---|---|---|---|---|---|---|---|---|---|---|
| Revenue | 8,215.9 | 20,699.4 | 21,701.6 | 19,070.2 | 18,679.7 | 22,913.9 | 28,107.8 | 34,479.1 | 42,294.6 | 51,881.6 |
| Revenue Growth, % | 0 | 151.94 | 4.84 | -12.13 | -2.05 | 22.67 | 22.67 | 22.67 | 22.67 | 22.67 |
| EBITDA | 1,125.3 | 6,150.8 | 4,640.9 | 2,911.7 | 1,780.1 | 4,105.9 | 5,036.6 | 6,178.2 | 7,578.6 | 9,296.5 |
| EBITDA, % | 13.7 | 29.71 | 21.38 | 15.27 | 9.53 | 17.92 | 17.92 | 17.92 | 17.92 | 17.92 |
| Depreciation | 574.7 | 1,075.1 | 1,245.2 | 1,234.8 | 1,480.6 | 1,481.5 | 1,817.3 | 2,229.3 | 2,734.6 | 3,354.4 |
| Depreciation, % | 6.99 | 5.19 | 5.74 | 6.48 | 7.93 | 6.47 | 6.47 | 6.47 | 6.47 | 6.47 |
| EBIT | 550.6 | 5,075.6 | 3,395.6 | 1,676.9 | 299.5 | 2,624.4 | 3,219.2 | 3,948.9 | 4,844.1 | 5,942.1 |
| EBIT, % | 6.7 | 24.52 | 15.65 | 8.79 | 1.6 | 11.45 | 11.45 | 11.45 | 11.45 | 11.45 |
| Total Cash | 3,084.4 | 9,295.0 | 4,742.3 | 4,855.7 | 2,770.6 | 6,626.4 | 8,128.4 | 9,970.9 | 12,231.1 | 15,003.5 |
| Total Cash, percent | .0 | .0 | .0 | .0 | .0 | .0 | .0 | .0 | .0 | .0 |
| Account Receivables | 4,302.4 | 4,985.6 | 5,932.3 | 6,712.8 | 6,348.6 | 7,927.1 | 9,723.9 | 11,928.1 | 14,631.9 | 17,948.5 |
| Account Receivables, % | 52.37 | 24.09 | 27.34 | 35.2 | 33.99 | 34.6 | 34.6 | 34.6 | 34.6 | 34.6 |
| Inventories | 1,622.0 | 3,043.0 | 5,029.8 | 5,356.3 | 5,975.6 | 5,393.8 | 6,616.5 | 8,116.2 | 9,955.9 | 12,212.7 |
| Inventories, % | 19.74 | 14.7 | 23.18 | 28.09 | 31.99 | 23.54 | 23.54 | 23.54 | 23.54 | 23.54 |
| Accounts Payable | 2,795.6 | 1,461.4 | 2,580.4 | 2,812.4 | 4,715.0 | 4,260.4 | 5,226.2 | 6,410.8 | 7,863.9 | 9,646.5 |
| Accounts Payable, % | 34.03 | 7.06 | 11.89 | 14.75 | 25.24 | 18.59 | 18.59 | 18.59 | 18.59 | 18.59 |
| Capital Expenditure | -643.5 | -1,378.7 | -4,304.0 | -5,963.4 | -3,825.8 | -3,944.7 | -4,838.9 | -5,935.7 | -7,281.2 | -8,931.6 |
| Capital Expenditure, % | -7.83 | -6.66 | -19.83 | -31.27 | -20.48 | -17.22 | -17.22 | -17.22 | -17.22 | -17.22 |
| Tax Rate, % | -33.85 | -33.85 | -33.85 | -33.85 | -33.85 | -33.85 | -33.85 | -33.85 | -33.85 | -33.85 |
| EBITAT | 429.7 | 3,626.5 | 2,691.7 | 1,298.3 | 400.9 | 2,131.9 | 2,615.2 | 3,208.0 | 3,935.2 | 4,827.1 |
| Depreciation | ||||||||||
| Changes in Account Receivables | ||||||||||
| Changes in Inventories | ||||||||||
| Changes in Accounts Payable | ||||||||||
| Capital Expenditure | ||||||||||
| UFCF | -2,767.9 | -115.5 | -2,181.7 | -4,305.2 | -296.8 | -1,782.5 | -2,460.1 | -3,017.7 | -3,701.8 | -4,540.9 |
| WACC, % | 7.73 | 7.65 | 7.75 | 7.72 | 8 | 7.77 | 7.77 | 7.77 | 7.77 | 7.77 |
| PV UFCF | ||||||||||
| SUM PV UFCF | -12,051.2 | |||||||||
| Long Term Growth Rate, % | 3.00 | |||||||||
| Free cash flow (T + 1) | -4,677 | |||||||||
| Terminal Value | -98,068 | |||||||||
| Present Terminal Value | -67,461 | |||||||||
| Enterprise Value | -79,512 | |||||||||
| Net Debt | 11,404 | |||||||||
| Equity Value | -90,916 | |||||||||
| Diluted Shares Outstanding, MM | 2,160 | |||||||||
| Equity Value Per Share | -42.10 |
What You Will Receive
- Customizable Excel Template: A fully adjustable Excel-based DCF Calculator featuring pre-filled financial data for Ningbo Shanshan Co., Ltd. (600884SS).
- Accurate Data: Access to historical figures and forward-looking projections (highlighted in the yellow cells).
- Adjustable Forecasts: Modify forecast assumptions such as revenue growth, EBITDA percentage, and WACC.
- Instant Calculations: Quickly observe how your inputs affect the valuation of Ningbo Shanshan Co., Ltd. (600884SS).
- Professional Resource: Designed for investors, CFOs, consultants, and financial analysts.
- Intuitive Layout: Organized for clarity and user-friendliness, complete with step-by-step guidance.
Key Features
- Authentic 600884SS Data: Pre-populated with Ningbo Shanshan Co., Ltd.'s historical financial figures and future estimates.
- Completely Customizable Parameters: Modify revenue growth rates, profit margins, WACC, tax percentages, and capital expenditure plans.
- Dynamic Valuation Framework: Instantaneous updates to Net Present Value (NPV) and intrinsic value reflecting your input adjustments.
- Scenario Analysis: Generate various forecast scenarios to evaluate different valuation results.
- Intuitive User Interface: Clear, organized, and crafted for both seasoned professionals and newcomers.
How It Functions
- 1. Access the Template: Download and open the Excel file featuring Ningbo Shanshan Co., Ltd.'s preloaded data.
- 2. Adjust Assumptions: Modify essential inputs such as growth rates, WACC, and capital expenditures.
- 3. Instant Result Analysis: The DCF model automatically computes intrinsic value and NPV in real-time.
- 4. Explore Different Scenarios: Evaluate various forecasts to investigate different valuation results.
- 5. Present with Confidence: Deliver professional valuation insights to inform your strategic decisions for Ningbo Shanshan Co., Ltd. (600884SS).
Why Choose Ningbo Shanshan Co., Ltd. (600884SS) Calculator?
- Reliable Data: Utilize authentic financial information from Ningbo Shanshan for trustworthy valuation outcomes.
- Flexible Options: Tailor critical variables such as growth rates, WACC, and tax rates to align with your forecasts.
- Efficiency Boost: Pre-configured calculations save you time and effort in your analysis.
- Professional-Quality Tool: Crafted for investors, analysts, and financial consultants.
- Easy to Use: A user-friendly interface with clear instructions ensures accessibility for everyone.
Who Can Benefit from This Product?
- Finance Students: Master valuation strategies and apply them to real-world data, including insights on Ningbo Shanshan Co., Ltd. (600884SS).
- Academics: Integrate advanced financial models into your teaching or research related to Ningbo Shanshan Co., Ltd. (600884SS).
- Investors: Evaluate your investment theories and assess the valuation projections for Ningbo Shanshan Co., Ltd. (600884SS).
- Analysts: Enhance your analytical processes with a customizable DCF model specifically designed for Ningbo Shanshan Co., Ltd. (600884SS).
- Small Business Owners: Discover how the evaluation of major companies like Ningbo Shanshan Co., Ltd. (600884SS) can inform your own business strategies.
Contents of the Template
- Pre-Filled DCF Model: Ningbo Shanshan Co., Ltd.'s financial data ready for immediate analysis.
- WACC Calculator: Comprehensive calculations for the Weighted Average Cost of Capital.
- Financial Ratios: Assess Ningbo Shanshan's profitability, leverage, and operational efficiency.
- Editable Inputs: Customize assumptions such as growth rates, profit margins, and capital expenditures for your specific scenarios.
- Financial Statements: Access to annual and quarterly reports to facilitate in-depth analysis.
- Interactive Dashboard: Effortlessly visualize key valuation metrics and outcomes.
Disclaimer
All information, articles, and product details provided on this website are for general informational and educational purposes only. We do not claim any ownership over, nor do we intend to infringe upon, any trademarks, copyrights, logos, brand names, or other intellectual property mentioned or depicted on this site. Such intellectual property remains the property of its respective owners, and any references here are made solely for identification or informational purposes, without implying any affiliation, endorsement, or partnership.
We make no representations or warranties, express or implied, regarding the accuracy, completeness, or suitability of any content or products presented. Nothing on this website should be construed as legal, tax, investment, financial, medical, or other professional advice. In addition, no part of this site—including articles or product references—constitutes a solicitation, recommendation, endorsement, advertisement, or offer to buy or sell any securities, franchises, or other financial instruments, particularly in jurisdictions where such activity would be unlawful.
All content is of a general nature and may not address the specific circumstances of any individual or entity. It is not a substitute for professional advice or services. Any actions you take based on the information provided here are strictly at your own risk. You accept full responsibility for any decisions or outcomes arising from your use of this website and agree to release us from any liability in connection with your use of, or reliance upon, the content or products found herein.