
|
AECC Aviation Power Co., Ltd (600893.SS) Évaluation DCF |
Entièrement Modifiable: Adapté À Vos Besoins Dans Excel Ou Sheets
Conception Professionnelle: Modèles Fiables Et Conformes Aux Normes Du Secteur
Pré-Construits Pour Une Utilisation Rapide Et Efficace
Compatible MAC/PC, entièrement débloqué
Aucune Expertise N'Est Requise; Facile À Suivre
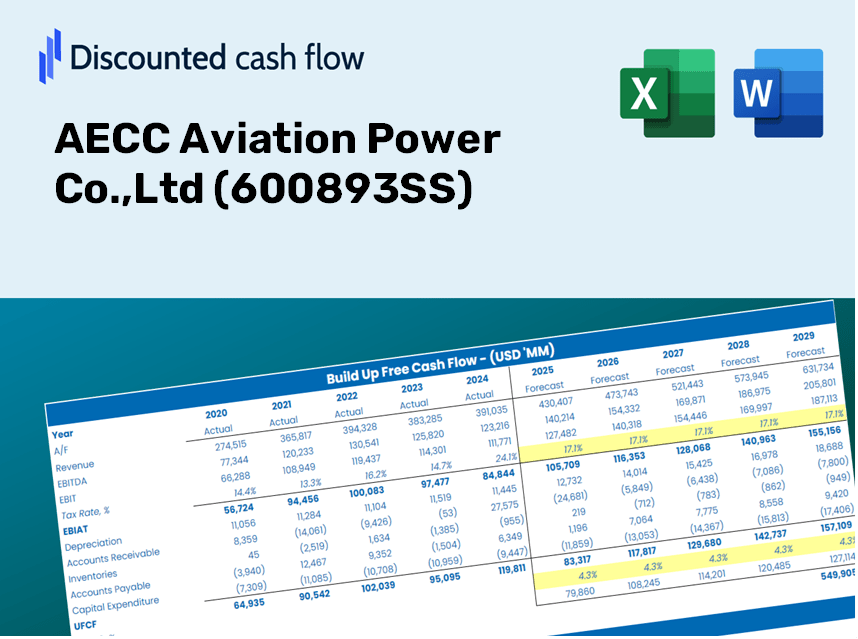
AECC Aviation Power Co.,Ltd (600893.SS) Bundle
Vous cherchez à évaluer AECC Aviation Power Co., la valeur intrinsèque de Ltd? Notre calculatrice DCF (600893SS) intègre des données réelles avec des fonctionnalités de personnalisation étendues, vous permettant d'affiner vos prévisions et d'améliorer vos choix d'investissement.
Discounted Cash Flow (DCF) - (USD MM)
| Year | AY1 2020 |
AY2 2021 |
AY3 2022 |
AY4 2023 |
AY5 2024 |
FY1 2025 |
FY2 2026 |
FY3 2027 |
FY4 2028 |
FY5 2029 |
|---|---|---|---|---|---|---|---|---|---|---|
| Revenue | 28,632.6 | 34,102.2 | 37,097.1 | 43,733.9 | 47,879.7 | 54,493.6 | 62,021.2 | 70,588.6 | 80,339.5 | 91,437.3 |
| Revenue Growth, % | 0 | 19.1 | 8.78 | 17.89 | 9.48 | 13.81 | 13.81 | 13.81 | 13.81 | 13.81 |
| EBITDA | 2,946.0 | 2,537.4 | 2,732.1 | 3,597.8 | 3,378.0 | 4,400.5 | 5,008.3 | 5,700.2 | 6,487.6 | 7,383.8 |
| EBITDA, % | 10.29 | 7.44 | 7.36 | 8.23 | 7.06 | 8.08 | 8.08 | 8.08 | 8.08 | 8.08 |
| Depreciation | 1,551.5 | 1,589.4 | 1,810.1 | 1,976.5 | 2,040.7 | 2,587.4 | 2,944.8 | 3,351.6 | 3,814.6 | 4,341.5 |
| Depreciation, % | 5.42 | 4.66 | 4.88 | 4.52 | 4.26 | 4.75 | 4.75 | 4.75 | 4.75 | 4.75 |
| EBIT | 1,394.5 | 948.0 | 922.0 | 1,621.3 | 1,337.2 | 1,813.1 | 2,063.5 | 2,348.6 | 2,673.0 | 3,042.2 |
| EBIT, % | 4.87 | 2.78 | 2.49 | 3.71 | 2.79 | 3.33 | 3.33 | 3.33 | 3.33 | 3.33 |
| Total Cash | 8,089.4 | 22,206.8 | 9,374.4 | 8,382.1 | 7,729.7 | 16,778.7 | 19,096.4 | 21,734.3 | 24,736.6 | 28,153.7 |
| Total Cash, percent | .0 | .0 | .0 | .0 | .0 | .0 | .0 | .0 | .0 | .0 |
| Account Receivables | 11,042.7 | 16,767.4 | 21,736.0 | 26,159.1 | 40,718.2 | 31,735.4 | 36,119.2 | 41,108.6 | 46,787.2 | 53,250.2 |
| Account Receivables, % | 38.57 | 49.17 | 58.59 | 59.81 | 85.04 | 58.24 | 58.24 | 58.24 | 58.24 | 58.24 |
| Inventories | 18,744.3 | 20,515.3 | 25,733.8 | 29,662.9 | 31,699.5 | 35,859.5 | 40,813.0 | 46,450.8 | 52,867.3 | 60,170.2 |
| Inventories, % | 65.47 | 60.16 | 69.37 | 67.83 | 66.21 | 65.8 | 65.8 | 65.8 | 65.8 | 65.8 |
| Accounts Payable | 18,222.4 | 22,596.8 | 26,569.2 | 32,585.0 | 41,582.1 | 39,549.2 | 45,012.4 | 51,230.3 | 58,307.0 | 66,361.4 |
| Accounts Payable, % | 63.64 | 66.26 | 71.62 | 74.51 | 86.85 | 72.58 | 72.58 | 72.58 | 72.58 | 72.58 |
| Capital Expenditure | -2,588.9 | -3,012.3 | -2,838.9 | .0 | .0 | -2,782.2 | -3,166.5 | -3,603.9 | -4,101.7 | -4,668.3 |
| Capital Expenditure, % | -9.04 | -8.83 | -7.65 | 0 | 0 | -5.11 | -5.11 | -5.11 | -5.11 | -5.11 |
| Tax Rate, % | 24.25 | 24.25 | 24.25 | 24.25 | 24.25 | 24.25 | 24.25 | 24.25 | 24.25 | 24.25 |
| EBITAT | 1,133.6 | 799.9 | 750.3 | 1,348.8 | 1,012.9 | 1,472.2 | 1,675.6 | 1,907.1 | 2,170.5 | 2,470.3 |
| Depreciation | ||||||||||
| Changes in Account Receivables | ||||||||||
| Changes in Inventories | ||||||||||
| Changes in Accounts Payable | ||||||||||
| Capital Expenditure | ||||||||||
| UFCF | -11,468.4 | -3,744.2 | -6,493.1 | 988.9 | -4,544.8 | 4,067.4 | -2,420.2 | -2,754.5 | -3,135.0 | -3,568.1 |
| WACC, % | 6.69 | 6.7 | 6.69 | 6.7 | 6.65 | 6.69 | 6.69 | 6.69 | 6.69 | 6.69 |
| PV UFCF | ||||||||||
| SUM PV UFCF | -5,583.9 | |||||||||
| Long Term Growth Rate, % | 3.50 | |||||||||
| Free cash flow (T + 1) | -3,693 | |||||||||
| Terminal Value | -115,919 | |||||||||
| Present Terminal Value | -83,873 | |||||||||
| Enterprise Value | -89,457 | |||||||||
| Net Debt | 12,919 | |||||||||
| Equity Value | -102,376 | |||||||||
| Diluted Shares Outstanding, MM | 2,688 | |||||||||
| Equity Value Per Share | -38.08 |
What You Will Receive
- Customizable Excel Template: A fully adaptable Excel-based DCF Calculator featuring pre-populated financial data for AECC Aviation Power Co., Ltd (600893SS).
- Accurate Data: Historical figures and projected estimates (highlighted in the yellow cells).
- Flexible Forecasting: Modify key assumptions such as revenue growth, EBITDA margin, and WACC.
- Real-Time Calculations: Immediately observe the effects of your inputs on the valuation of AECC Aviation Power Co., Ltd (600893SS).
- Professional Resource: Designed for investors, CFOs, consultants, and financial analysts.
- Intuitive Design: Organized for simplicity and ease of navigation, complete with step-by-step guidance.
Key Features
- Pre-Loaded Data: Historical financial statements and filled forecasts for AECC Aviation Power Co., Ltd (600893SS).
- Fully Adjustable Inputs: Customize WACC, tax rates, revenue growth, and EBITDA margins to suit your analysis.
- Instant Results: Monitor AECC Aviation Power's intrinsic value as it recalculates in real time.
- Clear Visual Outputs: Interactive dashboard charts present valuation results and essential metrics.
- Built for Accuracy: A professional-grade tool designed for analysts, investors, and finance professionals.
How It Operates
- Step 1: Download the ready-to-use Excel template containing AECC Aviation Power Co., Ltd's (600893SS) data.
- Step 2: Navigate through the pre-filled sheets to familiarize yourself with the essential metrics.
- Step 3: Revise forecasts and assumptions in the editable yellow cells (WACC, growth rates, margins).
- Step 4: Quickly access the updated results, including the intrinsic value of AECC Aviation Power Co., Ltd (600893SS).
- Step 5: Utilize the outputs to make well-informed investment choices or to create reports.
Why Choose AECC Aviation Power Co., Ltd (600893SS) Calculator?
- Precision: Utilizes authentic AECC Aviation Power financial data for reliable calculations.
- Adaptability: Created for users to easily experiment with and adjust inputs.
- Efficiency: Avoid the complications of constructing a financial model from the ground up.
- Expert-Level: Crafted with the accuracy and functionality expected at the CFO level.
- Intuitive Design: Simple to navigate, suitable for users with varying levels of financial modeling expertise.
Who Can Benefit from This Product?
- Investors: Evaluate the valuation of AECC Aviation Power Co., Ltd (600893SS) before making stock transactions.
- CFOs and Financial Analysts: Enhance valuation workflows and assess financial forecasts.
- Startup Founders: Gain insights into how leading public companies, such as AECC Aviation Power Co., Ltd (600893SS), are valued.
- Consultants: Provide detailed valuation reports to your clients.
- Students and Educators: Utilize actual market data to learn and teach valuation methodologies.
Contents of the AECC Aviation Power Template
- Operating and Balance Sheet Data: Pre-filled historical data and forecasts for AECC Aviation Power Co., Ltd (600893SS), including revenue, EBITDA, EBIT, and capital expenditures.
- WACC Calculation: A specialized sheet for calculating the Weighted Average Cost of Capital (WACC), featuring parameters such as Beta, risk-free rate, and share price.
- DCF Valuation (Unlevered and Levered): Customizable Discounted Cash Flow models that reveal intrinsic value along with detailed calculations.
- Financial Statements: Pre-loaded annual and quarterly financial statements for comprehensive analysis.
- Key Ratios: A selection of profitability, leverage, and efficiency ratios specific to AECC Aviation Power Co., Ltd (600893SS).
- Dashboard and Charts: A visual overview of valuation outputs and assumptions, facilitating easy analysis of the results.
Disclaimer
All information, articles, and product details provided on this website are for general informational and educational purposes only. We do not claim any ownership over, nor do we intend to infringe upon, any trademarks, copyrights, logos, brand names, or other intellectual property mentioned or depicted on this site. Such intellectual property remains the property of its respective owners, and any references here are made solely for identification or informational purposes, without implying any affiliation, endorsement, or partnership.
We make no representations or warranties, express or implied, regarding the accuracy, completeness, or suitability of any content or products presented. Nothing on this website should be construed as legal, tax, investment, financial, medical, or other professional advice. In addition, no part of this site—including articles or product references—constitutes a solicitation, recommendation, endorsement, advertisement, or offer to buy or sell any securities, franchises, or other financial instruments, particularly in jurisdictions where such activity would be unlawful.
All content is of a general nature and may not address the specific circumstances of any individual or entity. It is not a substitute for professional advice or services. Any actions you take based on the information provided here are strictly at your own risk. You accept full responsibility for any decisions or outcomes arising from your use of this website and agree to release us from any liability in connection with your use of, or reliance upon, the content or products found herein.