
|
Guangzhou Guangri Stock Co., Ltd. (600894.SS) Évaluation DCF |
Entièrement Modifiable: Adapté À Vos Besoins Dans Excel Ou Sheets
Conception Professionnelle: Modèles Fiables Et Conformes Aux Normes Du Secteur
Pré-Construits Pour Une Utilisation Rapide Et Efficace
Compatible MAC/PC, entièrement débloqué
Aucune Expertise N'Est Requise; Facile À Suivre
Guangzhou Guangri Stock Co.,Ltd. (600894.SS) Bundle
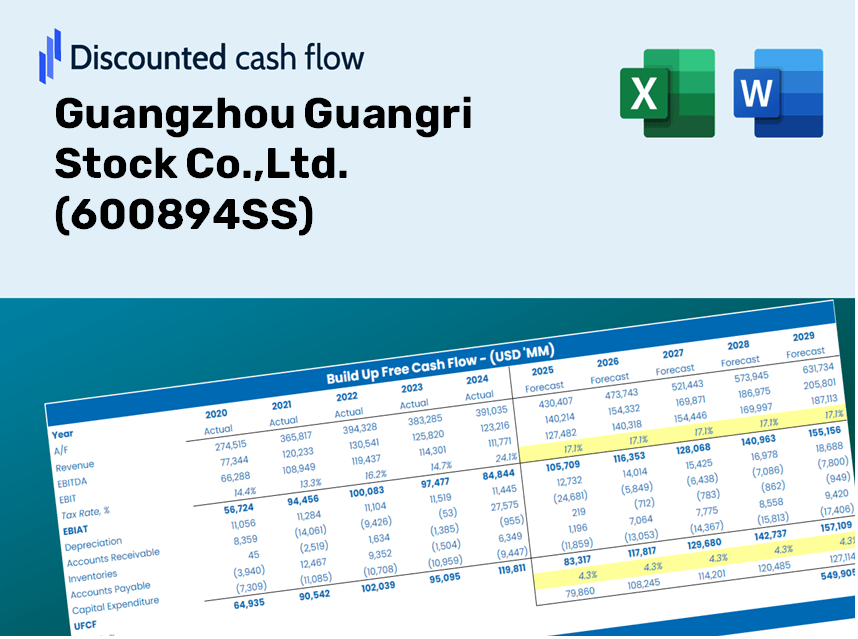
Découvrez la vraie valeur de Guangzhou Guangri Stock Co., Ltd. (600894SS) avec notre calculatrice DCF de qualité professionnelle! Ajustez les hypothèses clés, explorez divers scénarios et examinez comment les différents changements affectent l'évaluation de Guangzhou Guangri Stock Co., Ltd. (600894SS) - le tout dans un seul modèle Excel.
Discounted Cash Flow (DCF) - (USD MM)
| Year | AY1 2020 |
AY2 2021 |
AY3 2022 |
AY4 2023 |
AY5 2024 |
FY1 2025 |
FY2 2026 |
FY3 2027 |
FY4 2028 |
FY5 2029 |
|---|---|---|---|---|---|---|---|---|---|---|
| Revenue | 6,773.4 | 7,766.8 | 7,063.7 | 7,384.3 | 7,260.1 | 7,413.8 | 7,570.7 | 7,731.0 | 7,894.7 | 8,061.9 |
| Revenue Growth, % | 0 | 14.67 | -9.05 | 4.54 | -1.68 | 2.12 | 2.12 | 2.12 | 2.12 | 2.12 |
| EBITDA | 175.6 | 8.1 | -1.8 | -10.8 | 53.1 | 48.3 | 49.3 | 50.3 | 51.4 | 52.5 |
| EBITDA, % | 2.59 | 0.10369 | -0.02611701 | -0.14662 | 0.73136 | 0.65095 | 0.65095 | 0.65095 | 0.65095 | 0.65095 |
| Depreciation | 107.3 | 114.7 | 109.9 | 146.8 | 143.6 | 127.3 | 130.0 | 132.7 | 135.5 | 138.4 |
| Depreciation, % | 1.58 | 1.48 | 1.56 | 1.99 | 1.98 | 1.72 | 1.72 | 1.72 | 1.72 | 1.72 |
| EBIT | 68.3 | -106.7 | -111.7 | -157.6 | -90.5 | -79.0 | -80.7 | -82.4 | -84.1 | -85.9 |
| EBIT, % | 1.01 | -1.37 | -1.58 | -2.13 | -1.25 | -1.07 | -1.07 | -1.07 | -1.07 | -1.07 |
| Total Cash | 3,367.1 | 3,597.2 | 3,983.7 | 5,285.9 | 4,201.4 | 4,179.5 | 4,268.0 | 4,358.4 | 4,450.6 | 4,544.9 |
| Total Cash, percent | .0 | .0 | .0 | .0 | .0 | .0 | .0 | .0 | .0 | .0 |
| Account Receivables | 1,709.0 | 1,739.3 | 2,008.2 | 2,233.2 | 3,121.4 | 2,213.6 | 2,260.5 | 2,308.4 | 2,357.2 | 2,407.1 |
| Account Receivables, % | 25.23 | 22.39 | 28.43 | 30.24 | 42.99 | 29.86 | 29.86 | 29.86 | 29.86 | 29.86 |
| Inventories | 1,194.4 | 1,366.2 | 1,127.0 | 1,079.4 | 1,048.0 | 1,189.6 | 1,214.8 | 1,240.5 | 1,266.8 | 1,293.6 |
| Inventories, % | 17.63 | 17.59 | 15.95 | 14.62 | 14.44 | 16.05 | 16.05 | 16.05 | 16.05 | 16.05 |
| Accounts Payable | 2,102.0 | 2,221.1 | 2,395.2 | 2,852.5 | 2,310.0 | 2,431.5 | 2,483.0 | 2,535.5 | 2,589.2 | 2,644.1 |
| Accounts Payable, % | 31.03 | 28.6 | 33.91 | 38.63 | 31.82 | 32.8 | 32.8 | 32.8 | 32.8 | 32.8 |
| Capital Expenditure | -51.3 | -120.0 | -241.7 | -226.4 | -256.0 | -182.6 | -186.5 | -190.5 | -194.5 | -198.6 |
| Capital Expenditure, % | -0.7581 | -1.55 | -3.42 | -3.07 | -3.53 | -2.46 | -2.46 | -2.46 | -2.46 | -2.46 |
| Tax Rate, % | -1.02 | -1.02 | -1.02 | -1.02 | -1.02 | -1.02 | -1.02 | -1.02 | -1.02 | -1.02 |
| EBITAT | 65.8 | -105.9 | -112.2 | -164.5 | -91.4 | -78.3 | -80.0 | -81.6 | -83.4 | -85.1 |
| Depreciation | ||||||||||
| Changes in Account Receivables | ||||||||||
| Changes in Inventories | ||||||||||
| Changes in Accounts Payable | ||||||||||
| Capital Expenditure | ||||||||||
| UFCF | -679.7 | -194.3 | -99.5 | 35.6 | -1,603.1 | 754.0 | -157.1 | -160.4 | -163.8 | -167.3 |
| WACC, % | 5.95 | 5.95 | 5.95 | 5.95 | 5.95 | 5.95 | 5.95 | 5.95 | 5.95 | 5.95 |
| PV UFCF | ||||||||||
| SUM PV UFCF | 181.6 | |||||||||
| Long Term Growth Rate, % | 3.00 | |||||||||
| Free cash flow (T + 1) | -172 | |||||||||
| Terminal Value | -5,842 | |||||||||
| Present Terminal Value | -4,376 | |||||||||
| Enterprise Value | -4,194 | |||||||||
| Net Debt | -4,136 | |||||||||
| Equity Value | -58 | |||||||||
| Diluted Shares Outstanding, MM | 866 | |||||||||
| Equity Value Per Share | -0.07 |
What You'll Receive
- Customizable Excel Template: A fully adjustable Excel-based DCF Calculator featuring pre-populated financial data for Guangzhou Guangri Stock Co., Ltd. (600894SS).
- Relevant Data: Access to historical data and future projections (highlighted in the yellow cells).
- Flexible Forecasting: Modify key assumptions such as revenue growth, EBITDA percentage, and WACC.
- Real-Time Calculations: Quickly observe how your inputs influence the valuation of Guangzhou Guangri Stock Co., Ltd. (600894SS).
- Professional-Grade Tool: Designed for investors, CFOs, consultants, and financial analysts alike.
- Intuitive Layout: Organized for simplicity and user-friendliness, complete with step-by-step guidance.
Key Features
- 🔍 Real-Life 600894SS Financials: Pre-filled historical and projected data for Guangzhou Guangri Stock Co., Ltd.
- ✏️ Fully Customizable Inputs: Adjust all critical parameters (yellow cells) such as WACC, growth %, and tax rates.
- 📊 Professional DCF Valuation: Built-in formulas calculate Guangzhou Guangri's intrinsic value using the Discounted Cash Flow method.
- ⚡ Instant Results: Visualize Guangzhou Guangri's valuation instantly after making modifications.
- Scenario Analysis: Test and compare outcomes for various financial assumptions side-by-side.
How It Works
- Step 1: Download the Excel file.
- Step 2: Review Guangzhou Guangri Stock Co., Ltd.'s pre-filled financial data and forecasts.
- Step 3: Adjust key inputs such as revenue growth, WACC, and tax rates (highlighted cells).
- Step 4: Observe the DCF model update in real-time as you modify assumptions.
- Step 5: Evaluate the outputs and leverage the results for your investment decisions regarding (600894SS).
Why Opt for This Calculator?
- Precision: Leverage authentic Guangzhou Guangri Stock Co., Ltd. (600894SS) financial data for reliable results.
- Versatility: Built to allow users to easily adjust and experiment with various inputs.
- Efficiency: Eliminate the need to construct a DCF model from the ground up.
- High-Quality: Crafted with the expertise and attention to detail expected at the CFO level.
- Intuitive: User-friendly interface, accessible even to those new to financial modeling.
Who Can Benefit from This Product?
- Finance Students: Master valuation techniques and practice with real market data.
- Researchers: Integrate industry-standard models into academic studies or projects.
- Investors: Evaluate your hypotheses and analyze valuation scenarios for Guangzhou Guangri Stock Co.,Ltd. (600894SS).
- Financial Analysts: Enhance your efficiency with a ready-to-use, customizable DCF model.
- Entrepreneurs: Understand the valuation processes of major public companies, like Guangzhou Guangri Stock Co.,Ltd. (600894SS).
Contents of the Template
- Preloaded 600894SS Data: Historical and projected financial metrics, including revenue, EBIT, and capital expenditures.
- DCF and WACC Models: Professional-grade templates for determining intrinsic value and Weighted Average Cost of Capital.
- Editable Inputs: Yellow-highlighted fields for customizing revenue growth, tax rates, and discount rates.
- Financial Statements: Detailed annual and quarterly financials for thorough analysis.
- Key Ratios: Ratios assessing profitability, leverage, and efficiency to gauge performance.
- Dashboard and Charts: Visual representations of valuation results and underlying assumptions.
Disclaimer
All information, articles, and product details provided on this website are for general informational and educational purposes only. We do not claim any ownership over, nor do we intend to infringe upon, any trademarks, copyrights, logos, brand names, or other intellectual property mentioned or depicted on this site. Such intellectual property remains the property of its respective owners, and any references here are made solely for identification or informational purposes, without implying any affiliation, endorsement, or partnership.
We make no representations or warranties, express or implied, regarding the accuracy, completeness, or suitability of any content or products presented. Nothing on this website should be construed as legal, tax, investment, financial, medical, or other professional advice. In addition, no part of this site—including articles or product references—constitutes a solicitation, recommendation, endorsement, advertisement, or offer to buy or sell any securities, franchises, or other financial instruments, particularly in jurisdictions where such activity would be unlawful.
All content is of a general nature and may not address the specific circumstances of any individual or entity. It is not a substitute for professional advice or services. Any actions you take based on the information provided here are strictly at your own risk. You accept full responsibility for any decisions or outcomes arising from your use of this website and agree to release us from any liability in connection with your use of, or reliance upon, the content or products found herein.