
|
China Yangtze Power Co., Ltd. (600900.SS) Évaluation DCF |
Entièrement Modifiable: Adapté À Vos Besoins Dans Excel Ou Sheets
Conception Professionnelle: Modèles Fiables Et Conformes Aux Normes Du Secteur
Pré-Construits Pour Une Utilisation Rapide Et Efficace
Compatible MAC/PC, entièrement débloqué
Aucune Expertise N'Est Requise; Facile À Suivre
China Yangtze Power Co., Ltd. (600900.SS) Bundle
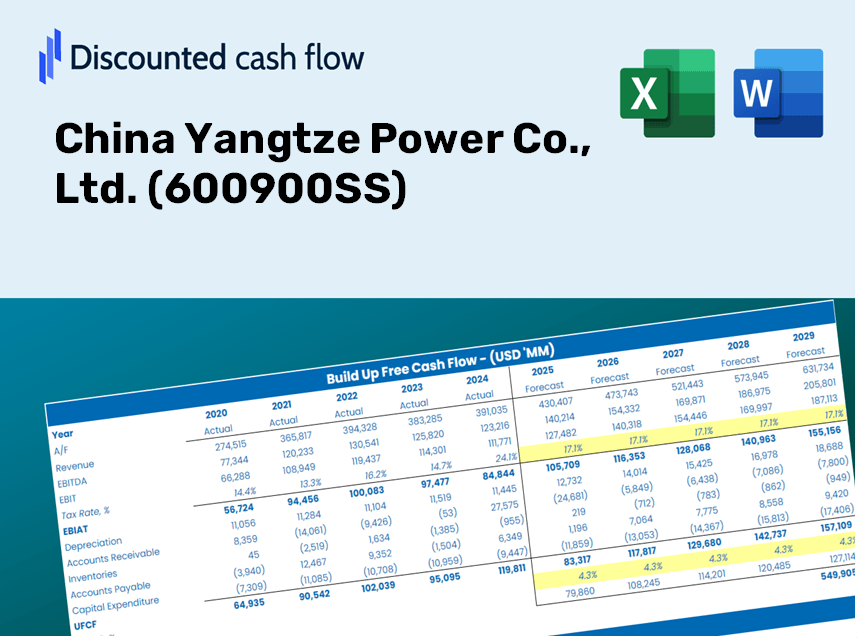
Simplifiez China Yangtze Power Co., Ltd. (600900SS) Évaluation avec cette calculatrice DCF personnalisable! Doté de Real China Yangtze Power Co., Ltd. (600900SS) Financials and Adjustable Prévisions, vous pouvez tester des scénarios et découvrir la juste valeur de China Yangtze Power Co., Ltd. (600900SS).
Discounted Cash Flow (DCF) - (USD MM)
| Year | AY1 2020 |
AY2 2021 |
AY3 2022 |
AY4 2023 |
AY5 2024 |
FY1 2025 |
FY2 2026 |
FY3 2027 |
FY4 2028 |
FY5 2029 |
|---|---|---|---|---|---|---|---|---|---|---|
| Revenue | 56,590.4 | 54,482.6 | 67,403.1 | 76,541.9 | 82,523.9 | 91,057.6 | 100,473.9 | 110,863.8 | 122,328.2 | 134,978.1 |
| Revenue Growth, % | 0 | -3.72 | 23.71 | 13.56 | 7.82 | 10.34 | 10.34 | 10.34 | 10.34 | 10.34 |
| EBITDA | 46,146.6 | 45,907.9 | 53,037.0 | 60,201.3 | 65,640.4 | 73,335.1 | 80,918.7 | 89,286.5 | 98,519.5 | 108,707.4 |
| EBITDA, % | 81.54 | 84.26 | 78.69 | 78.65 | 79.54 | 80.54 | 80.54 | 80.54 | 80.54 | 80.54 |
| Depreciation | 11,636.2 | 11,494.6 | 16,971.7 | 19,227.8 | 19,778.0 | 21,112.0 | 23,295.1 | 25,704.1 | 28,362.1 | 31,295.1 |
| Depreciation, % | 20.56 | 21.1 | 25.18 | 25.12 | 23.97 | 23.19 | 23.19 | 23.19 | 23.19 | 23.19 |
| EBIT | 34,510.3 | 34,413.3 | 36,065.2 | 40,973.5 | 45,862.4 | 52,223.2 | 57,623.5 | 63,582.4 | 70,157.4 | 77,412.3 |
| EBIT, % | 60.98 | 63.16 | 53.51 | 53.53 | 55.57 | 57.35 | 57.35 | 57.35 | 57.35 | 57.35 |
| Total Cash | 9,231.2 | 9,930.0 | 9,302.2 | 7,778.4 | 6,555.3 | 12,100.6 | 13,352.0 | 14,732.7 | 16,256.2 | 17,937.2 |
| Total Cash, percent | .0 | .0 | .0 | .0 | .0 | .0 | .0 | .0 | .0 | .0 |
| Account Receivables | 3,667.7 | 3,768.8 | 16,487.2 | 8,822.9 | 9,649.6 | 11,123.4 | 12,273.7 | 13,542.9 | 14,943.4 | 16,488.7 |
| Account Receivables, % | 6.48 | 6.92 | 24.46 | 11.53 | 11.69 | 12.22 | 12.22 | 12.22 | 12.22 | 12.22 |
| Inventories | 282.1 | 470.0 | 453.4 | 586.5 | 642.0 | 651.6 | 719.0 | 793.4 | 875.4 | 965.9 |
| Inventories, % | 0.49842 | 0.86272 | 0.67267 | 0.76631 | 0.77793 | 0.71561 | 0.71561 | 0.71561 | 0.71561 | 0.71561 |
| Accounts Payable | 894.3 | 693.9 | 1,005.4 | 1,516.0 | 1,611.5 | 1,507.7 | 1,663.6 | 1,835.7 | 2,025.5 | 2,235.0 |
| Accounts Payable, % | 1.58 | 1.27 | 1.49 | 1.98 | 1.95 | 1.66 | 1.66 | 1.66 | 1.66 | 1.66 |
| Capital Expenditure | -3,627.9 | -3,473.9 | -12,469.7 | -12,417.1 | -14,420.1 | -11,834.5 | -13,058.3 | -14,408.6 | -15,898.6 | -17,542.7 |
| Capital Expenditure, % | -6.41 | -6.38 | -18.5 | -16.22 | -17.47 | -13 | -13 | -13 | -13 | -13 |
| Tax Rate, % | 16.38 | 16.38 | 16.38 | 16.38 | 16.38 | 16.38 | 16.38 | 16.38 | 16.38 | 16.38 |
| EBITAT | 27,962.8 | 27,897.5 | 28,746.9 | 34,421.2 | 38,349.5 | 42,763.3 | 47,185.4 | 52,064.9 | 57,448.9 | 63,389.7 |
| Depreciation | ||||||||||
| Changes in Account Receivables | ||||||||||
| Changes in Inventories | ||||||||||
| Changes in Accounts Payable | ||||||||||
| Capital Expenditure | ||||||||||
| UFCF | 32,915.8 | 35,428.8 | 20,858.6 | 49,273.7 | 42,920.7 | 50,453.6 | 56,360.6 | 62,188.8 | 68,619.7 | 75,715.6 |
| WACC, % | 4.3 | 4.3 | 4.29 | 4.34 | 4.34 | 4.31 | 4.31 | 4.31 | 4.31 | 4.31 |
| PV UFCF | ||||||||||
| SUM PV UFCF | 274,204.2 | |||||||||
| Long Term Growth Rate, % | 2.00 | |||||||||
| Free cash flow (T + 1) | 77,230 | |||||||||
| Terminal Value | 3,337,334 | |||||||||
| Present Terminal Value | 2,701,992 | |||||||||
| Enterprise Value | 2,976,196 | |||||||||
| Net Debt | 244,049 | |||||||||
| Equity Value | 2,732,147 | |||||||||
| Diluted Shares Outstanding, MM | 24,468 | |||||||||
| Equity Value Per Share | 111.66 |
Benefits You Will Receive
- Authentic China Yangtze Power Data: Preloaded financials – encompassing revenue through EBIT – derived from both actual and projected figures.
- Complete Customization: Modify all key parameters (yellow cells) such as WACC, growth %, and tax rates.
- Real-Time Valuation Adjustments: Automatic recalculations to evaluate the effects of changes on the fair value of China Yangtze Power (600900SS).
- Flexible Excel Template: Designed for easy modifications, scenario analysis, and comprehensive projections.
- Efficient and Precise: Bypass the need to create models from scratch while ensuring accuracy and adaptability.
Key Features
- Real-Life (600900SS) Data: Pre-filled with China Yangtze Power's historical financials and future projections.
- Fully Customizable Inputs: Modify revenue growth, profit margins, WACC, tax rates, and capital expenditures to suit your analysis.
- Dynamic Valuation Model: Automatically updates Net Present Value (NPV) and intrinsic value based on your specified inputs.
- Scenario Testing: Generate multiple forecasting scenarios to explore various valuation results.
- User-Friendly Design: Intuitive and organized layout, suitable for both experienced professionals and newcomers.
How It Works
- Step 1: Download the Excel file for China Yangtze Power Co., Ltd. (600900SS).
- Step 2: Examine the pre-filled financial data and forecasts specific to China Yangtze Power Co., Ltd. (600900SS).
- Step 3: Adjust key variables such as revenue growth, WACC, and tax rates (highlighted cells).
- Step 4: Observe the DCF model update in real time as you modify your assumptions.
- Step 5: Review the outputs and leverage the results for your investment strategies.
Why Choose This Calculator for China Yangtze Power Co., Ltd. (600900SS)?
- Precision: Leverage authentic financial data for optimal accuracy.
- Customizability: Built to allow users to easily test and adjust various inputs.
- Efficiency: Eliminate the need to construct a DCF model from the ground up.
- Expert-Level: Crafted with the expertise and rigor suited for CFOs.
- Intuitive: Simple to navigate, even for users without a background in financial modeling.
Who Can Benefit from This Product?
- Institutional Investors: Develop comprehensive and robust valuation models for evaluating investment opportunities in China Yangtze Power Co., Ltd. (600900SS).
- Corporate Finance Departments: Assess various valuation scenarios to inform strategic decisions within their organizations.
- Consultants and Financial Advisors: Deliver precise valuation insights and recommendations regarding China Yangtze Power Co., Ltd. (600900SS) to clients.
- Students and Instructors: Utilize up-to-date market data to enhance learning and teaching of financial modeling techniques.
- Energy Sector Enthusiasts: Gain insight into how utility companies like China Yangtze Power Co., Ltd. (600900SS) are valued in the financial markets.
Contents of the Template
- Historical Data: Features past financials and baseline forecasts for China Yangtze Power Co., Ltd. (600900SS).
- DCF and Levered DCF Models: Comprehensive templates for calculating the intrinsic value of China Yangtze Power Co., Ltd. (600900SS).
- WACC Sheet: Pre-configured calculations for the Weighted Average Cost of Capital.
- Editable Inputs: Customize essential drivers such as growth rates, EBITDA %, and CAPEX assumptions.
- Quarterly and Annual Statements: Detailed analysis of the financial statements of China Yangtze Power Co., Ltd. (600900SS).
- Interactive Dashboard: Explore valuation results and projections in a dynamic visual format.
Disclaimer
All information, articles, and product details provided on this website are for general informational and educational purposes only. We do not claim any ownership over, nor do we intend to infringe upon, any trademarks, copyrights, logos, brand names, or other intellectual property mentioned or depicted on this site. Such intellectual property remains the property of its respective owners, and any references here are made solely for identification or informational purposes, without implying any affiliation, endorsement, or partnership.
We make no representations or warranties, express or implied, regarding the accuracy, completeness, or suitability of any content or products presented. Nothing on this website should be construed as legal, tax, investment, financial, medical, or other professional advice. In addition, no part of this site—including articles or product references—constitutes a solicitation, recommendation, endorsement, advertisement, or offer to buy or sell any securities, franchises, or other financial instruments, particularly in jurisdictions where such activity would be unlawful.
All content is of a general nature and may not address the specific circumstances of any individual or entity. It is not a substitute for professional advice or services. Any actions you take based on the information provided here are strictly at your own risk. You accept full responsibility for any decisions or outcomes arising from your use of this website and agree to release us from any liability in connection with your use of, or reliance upon, the content or products found herein.