
|
China Three Gorges Renewables Co., Ltd. (600905.SS) Évaluation DCF |
Entièrement Modifiable: Adapté À Vos Besoins Dans Excel Ou Sheets
Conception Professionnelle: Modèles Fiables Et Conformes Aux Normes Du Secteur
Pré-Construits Pour Une Utilisation Rapide Et Efficace
Compatible MAC/PC, entièrement débloqué
Aucune Expertise N'Est Requise; Facile À Suivre
China Three Gorges Renewables (Group) Co.,Ltd. (600905.SS) Bundle
Améliorez vos stratégies d'investissement avec la calculatrice DCF (600905SS)! Explorez des données financières authentiques pour la Chine Three Gorges Renewables (Group) Co., Ltd., Ajustez les prévisions et dépenses de croissance et observez les effets immédiats sur la valeur intrinsèque de (600905SS).
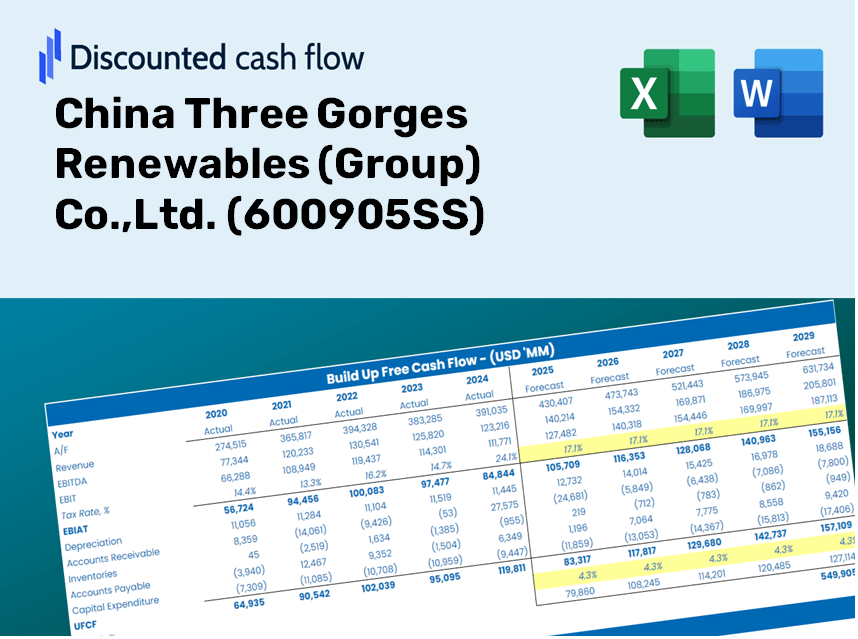
Discounted Cash Flow (DCF) - (USD MM)
| Year | AY1 2020 |
AY2 2021 |
AY3 2022 |
AY4 2023 |
AY5 2024 |
FY1 2025 |
FY2 2026 |
FY3 2027 |
FY4 2028 |
FY5 2029 |
|---|---|---|---|---|---|---|---|---|---|---|
| Revenue | 11,314.9 | 16,417.1 | 23,812.2 | 26,501.6 | 29,717.0 | 38,154.1 | 48,986.4 | 62,894.3 | 80,750.7 | 103,676.7 |
| Revenue Growth, % | 0 | 45.09 | 45.04 | 11.29 | 12.13 | 28.39 | 28.39 | 28.39 | 28.39 | 28.39 |
| EBITDA | 9,767.4 | 13,831.5 | 20,050.8 | 21,721.5 | 24,434.0 | 31,970.2 | 41,046.9 | 52,700.6 | 67,662.9 | 86,873.2 |
| EBITDA, % | 86.32 | 84.25 | 84.2 | 81.96 | 82.22 | 83.79 | 83.79 | 83.79 | 83.79 | 83.79 |
| Depreciation | 3,956.5 | 5,181.6 | 7,850.6 | 9,615.5 | 11,608.2 | 13,342.0 | 17,129.9 | 21,993.3 | 28,237.4 | 36,254.4 |
| Depreciation, % | 34.97 | 31.56 | 32.97 | 36.28 | 39.06 | 34.97 | 34.97 | 34.97 | 34.97 | 34.97 |
| EBIT | 5,810.8 | 8,649.9 | 12,200.2 | 12,106.0 | 12,825.8 | 18,628.2 | 23,917.0 | 30,707.3 | 39,425.5 | 50,618.8 |
| EBIT, % | 51.36 | 52.69 | 51.24 | 45.68 | 43.16 | 48.82 | 48.82 | 48.82 | 48.82 | 48.82 |
| Total Cash | 1,889.8 | 13,077.4 | 10,565.5 | 5,099.7 | 5,430.5 | 13,601.6 | 17,463.3 | 22,421.3 | 28,787.0 | 36,960.0 |
| Total Cash, percent | .0 | .0 | .0 | .0 | .0 | .0 | .0 | .0 | .0 | .0 |
| Account Receivables | 12,735.4 | 19,462.1 | 27,007.3 | 37,719.4 | 45,902.3 | 38,154.1 | 48,986.4 | 62,894.3 | 80,750.7 | 103,676.7 |
| Account Receivables, % | 112.55 | 118.55 | 113.42 | 142.33 | 154.46 | 100 | 100 | 100 | 100 | 100 |
| Inventories | 79.2 | 131.0 | 222.2 | 352.9 | 469.9 | 407.8 | 523.6 | 672.2 | 863.1 | 1,108.1 |
| Inventories, % | 0.7002 | 0.79772 | 0.93315 | 1.33 | 1.58 | 1.07 | 1.07 | 1.07 | 1.07 | 1.07 |
| Accounts Payable | 7,695.5 | 21,862.2 | 24,940.1 | 21,771.4 | 28,914.1 | 34,144.9 | 43,839.0 | 56,285.5 | 72,265.5 | 92,782.6 |
| Accounts Payable, % | 68.01 | 133.17 | 104.74 | 82.15 | 97.3 | 89.49 | 89.49 | 89.49 | 89.49 | 89.49 |
| Capital Expenditure | -25,456.0 | -29,906.2 | -27,730.5 | -41,111.7 | -30,873.8 | -38,154.1 | -48,986.4 | -62,894.3 | -80,750.7 | -103,676.7 |
| Capital Expenditure, % | -224.98 | -182.16 | -116.46 | -155.13 | -103.89 | -100 | -100 | -100 | -100 | -100 |
| Tax Rate, % | 28.61 | 28.61 | 28.61 | 28.61 | 28.61 | 28.61 | 28.61 | 28.61 | 28.61 | 28.61 |
| EBITAT | 4,896.2 | 7,418.5 | 9,641.9 | 9,637.5 | 9,156.7 | 14,904.7 | 19,136.3 | 24,569.3 | 31,544.9 | 40,500.8 |
| Depreciation | ||||||||||
| Changes in Account Receivables | ||||||||||
| Changes in Inventories | ||||||||||
| Changes in Accounts Payable | ||||||||||
| Capital Expenditure | ||||||||||
| UFCF | -21,722.5 | -9,917.8 | -14,796.5 | -35,870.4 | -11,266.0 | 3,133.8 | -13,974.2 | -17,941.7 | -23,035.6 | -29,575.6 |
| WACC, % | 3.69 | 3.72 | 3.58 | 3.59 | 3.43 | 3.6 | 3.6 | 3.6 | 3.6 | 3.6 |
| PV UFCF | ||||||||||
| SUM PV UFCF | -70,906.3 | |||||||||
| Long Term Growth Rate, % | 2.00 | |||||||||
| Free cash flow (T + 1) | -30,167 | |||||||||
| Terminal Value | -1,884,108 | |||||||||
| Present Terminal Value | -1,578,641 | |||||||||
| Enterprise Value | -1,649,547 | |||||||||
| Net Debt | 152,137 | |||||||||
| Equity Value | -1,801,684 | |||||||||
| Diluted Shares Outstanding, MM | 28,625 | |||||||||
| Equity Value Per Share | -62.94 |
What You Will Receive
- Genuine CTG Financial Data: Access to both historical and projected figures for precise assessments.
- Customizable Parameters: Adjust WACC, tax rates, revenue growth, and capital expenditure inputs.
- Real-Time Calculations: Automatically computes intrinsic value and NPV as conditions change.
- Scenario Planning: Analyze various scenarios to forecast the future performance of China Three Gorges Renewables (Group) Co., Ltd. (600905SS).
- User-Friendly Design: Designed for industry experts while remaining approachable for newcomers.
Key Features
- Current CTHG Data: Pre-populated with China Three Gorges Renewables’ historical financials and future growth projections.
- Fully Customizable Inputs: Tailor revenue growth rates, profit margins, WACC, tax rates, and capital expenditure assumptions.
- Dynamic Valuation Model: Instant updates to Net Present Value (NPV) and intrinsic value based on user-defined parameters.
- Scenario Analysis: Develop various forecast scenarios to explore different valuation results.
- User-Friendly Interface: Intuitive, organized, and suitable for both seasoned professionals and newcomers.
How It Operates
- Step 1: Download the Excel file.
- Step 2: Examine the pre-filled financial data and projections for China Three Gorges Renewables (Group) Co., Ltd. (600905SS).
- Step 3: Adjust key inputs such as revenue growth, WACC, and tax rates (highlighted cells).
- Step 4: Observe the DCF model update in real-time as you modify your assumptions.
- Step 5: Evaluate the results and leverage the findings for your investment strategies.
Why Choose This Calculator for China Three Gorges Renewables (Group) Co., Ltd. (600905SS)?
- Tailored for Industry Experts: A precise tool crafted for analysts, CFOs, and energy consultants.
- Comprehensive Data: Historical and projected financials for China Three Gorges Renewables preloaded for optimal accuracy.
- Dynamic Scenario Analysis: Effortlessly model various forecasts and assumptions.
- Transparent Outputs: Instantly computes intrinsic value, NPV, and essential metrics.
- User-Friendly: Step-by-step guidance simplifies your experience throughout the process.
Who Should Use This Product?
- Investors: Accurately assess the fair value of China Three Gorges Renewables (Group) Co.,Ltd. (600905SS) before making investment decisions.
- CFOs: Utilize an advanced DCF model for comprehensive financial reporting and analysis.
- Consultants: Easily customize the template for valuation reports tailored to your clients' needs.
- Entrepreneurs: Discover financial modeling techniques employed by industry leaders in renewable energy.
- Educators: Implement it as a teaching resource to illustrate valuation techniques in finance.
Contents of the Template
- Preloaded 600905SS Data: Historical and projected financial figures, encompassing revenue, EBIT, and capital expenditures.
- DCF and WACC Models: Advanced spreadsheets for determining intrinsic value and Weighted Average Cost of Capital.
- Editable Inputs: Yellow-highlighted cells for customizing revenue growth, tax rates, and discount rates.
- Financial Statements: Detailed annual and quarterly financials for in-depth evaluation.
- Key Ratios: Metrics for profitability, leverage, and efficiency to assess performance.
- Dashboard and Charts: Visual representations of valuation results and underlying assumptions.
Disclaimer
All information, articles, and product details provided on this website are for general informational and educational purposes only. We do not claim any ownership over, nor do we intend to infringe upon, any trademarks, copyrights, logos, brand names, or other intellectual property mentioned or depicted on this site. Such intellectual property remains the property of its respective owners, and any references here are made solely for identification or informational purposes, without implying any affiliation, endorsement, or partnership.
We make no representations or warranties, express or implied, regarding the accuracy, completeness, or suitability of any content or products presented. Nothing on this website should be construed as legal, tax, investment, financial, medical, or other professional advice. In addition, no part of this site—including articles or product references—constitutes a solicitation, recommendation, endorsement, advertisement, or offer to buy or sell any securities, franchises, or other financial instruments, particularly in jurisdictions where such activity would be unlawful.
All content is of a general nature and may not address the specific circumstances of any individual or entity. It is not a substitute for professional advice or services. Any actions you take based on the information provided here are strictly at your own risk. You accept full responsibility for any decisions or outcomes arising from your use of this website and agree to release us from any liability in connection with your use of, or reliance upon, the content or products found herein.