
|
Guangxi Radio and Television Information Network Corporation Limited (600936.SS) Évaluation DCF |
Entièrement Modifiable: Adapté À Vos Besoins Dans Excel Ou Sheets
Conception Professionnelle: Modèles Fiables Et Conformes Aux Normes Du Secteur
Pré-Construits Pour Une Utilisation Rapide Et Efficace
Compatible MAC/PC, entièrement débloqué
Aucune Expertise N'Est Requise; Facile À Suivre
Guangxi Radio and Television Information Network Corporation Limited (600936.SS) Bundle
Évaluez les perspectives financières de Guangxi Radio and Television Information Network Corporation Limited comme un expert! Ce calculatrice DCF (600936SS) vous fournit des données financières pré-remplies et une flexibilité complète pour modifier la croissance des revenus, le WACC, les marges et autres hypothèses essentielles pour s'aligner sur vos prévisions.
What You Will Receive
- Customizable Excel Template: A fully adjustable Excel-based DCF Calculator featuring pre-filled financial data for Guangxi Radio and Television Information Network Corporation Limited (600936SS).
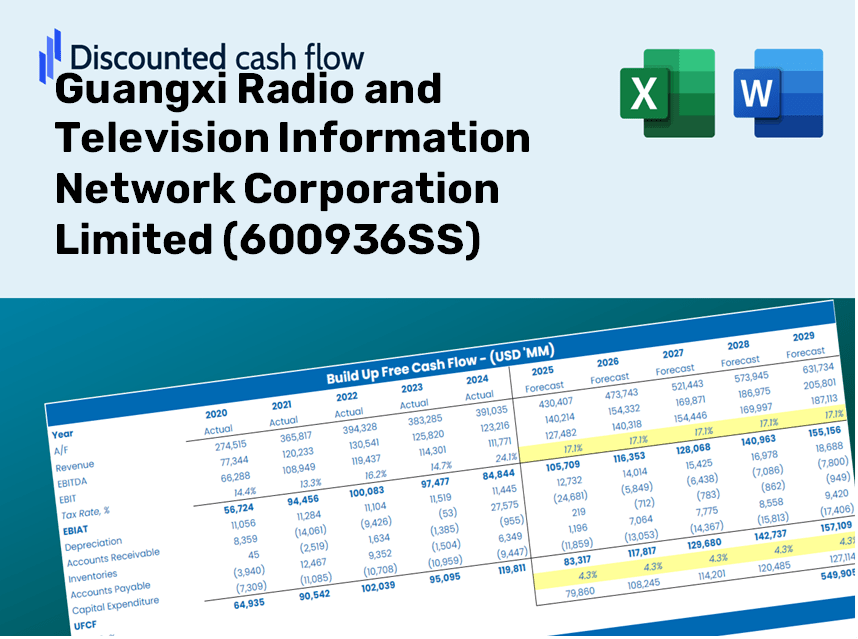
- Authentic Financial Data: Access to historical performance metrics and forward-looking projections (highlighted in the yellow cells).
- Flexible Forecasting: Modify assumptions such as revenue growth, EBITDA %, and WACC as needed.
- Instant Calculations: Quickly assess how your inputs influence the valuation of Guangxi Radio and Television Information Network Corporation Limited (600936SS).
- Professional Resource: Designed for investors, CFOs, consultants, and financial analysts.
- User-Friendly Interface: Organized for simplicity and accessibility, complete with step-by-step guidance.
Core Features
- Authentic Guangxi Radio Data: Pre-loaded with Guangxi Radio and Television Information Network Corporation Limited’s historical performance and future outlook.
- Customizable Parameters: Modify variables such as revenue growth, operating margins, WACC, tax rates, and capital expenditures to fit your analysis.
- Interactive Valuation Framework: Instantaneous recalculations of Net Present Value (NPV) and intrinsic value based on user-defined inputs.
- Scenario Analysis: Develop various forecast scenarios to explore different potential valuation results.
- Intuitive User Interface: Clean, organized, and suitable for both experienced investors and newcomers.
How It Works
- Step 1: Download the Excel file.
- Step 2: Examine the pre-filled financial data and forecasts for Guangxi Radio and Television Information Network Corporation Limited (600936SS).
- Step 3: Adjust key inputs such as revenue growth, WACC, and tax rates (highlighted cells).
- Step 4: Observe the DCF model update in real-time as you modify your assumptions.
- Step 5: Evaluate the outputs and leverage the results for your investment decisions.
Why Choose This Tool for Guangxi Radio and Television Information Network Corporation Limited (600936SS)?
- Precision: Accurate financial insights based on genuine data from (600936SS).
- Adaptability: Allows users to experiment and adjust parameters with ease.
- Efficiency: Eliminate the need to create a financial model from the ground up.
- Expert-Grade: Crafted with the expertise and attention to detail expected from top financial professionals.
- Intuitive: Simple to navigate, suitable for those without extensive financial modeling skills.
Who Can Benefit from This Product?
- Investors: Assess the valuation of Guangxi Radio and Television Information Network Corporation Limited (600936SS) before making investment decisions.
- CFOs and Financial Analysts: Enhance valuation procedures and evaluate forecasts related to (600936SS).
- Startup Founders: Gain insights into how prominent public companies, such as Guangxi Radio and Television Information Network Corporation Limited (600936SS), are valued in the market.
- Consultants: Create sophisticated valuation reports for your clients using data on (600936SS).
- Students and Educators: Employ real-world data from Guangxi Radio and Television Information Network Corporation Limited (600936SS) to practice and teach valuation strategies.
Contents of the Template
- Detailed DCF Model: An editable framework featuring comprehensive valuation computations.
- Actual Data: Preloaded historical and forecasted financial information for Guangxi Radio and Television Information Network Corporation Limited (600936SS) for in-depth analysis.
- Adjustable Parameters: Modify WACC, growth rates, and tax assumptions to explore various scenarios.
- Financial Statements: Complete annual and quarterly reports for enhanced insights.
- Key Financial Ratios: Integrated analysis focusing on profitability, efficiency, and leverage metrics.
- Visual Dashboard: Graphs and tables providing clear and actionable results.
Disclaimer
All information, articles, and product details provided on this website are for general informational and educational purposes only. We do not claim any ownership over, nor do we intend to infringe upon, any trademarks, copyrights, logos, brand names, or other intellectual property mentioned or depicted on this site. Such intellectual property remains the property of its respective owners, and any references here are made solely for identification or informational purposes, without implying any affiliation, endorsement, or partnership.
We make no representations or warranties, express or implied, regarding the accuracy, completeness, or suitability of any content or products presented. Nothing on this website should be construed as legal, tax, investment, financial, medical, or other professional advice. In addition, no part of this site—including articles or product references—constitutes a solicitation, recommendation, endorsement, advertisement, or offer to buy or sell any securities, franchises, or other financial instruments, particularly in jurisdictions where such activity would be unlawful.
All content is of a general nature and may not address the specific circumstances of any individual or entity. It is not a substitute for professional advice or services. Any actions you take based on the information provided here are strictly at your own risk. You accept full responsibility for any decisions or outcomes arising from your use of this website and agree to release us from any liability in connection with your use of, or reliance upon, the content or products found herein.