
|
Hunan New Welful Co., Ltd. (600975.SS) Évaluation DCF |
Entièrement Modifiable: Adapté À Vos Besoins Dans Excel Ou Sheets
Conception Professionnelle: Modèles Fiables Et Conformes Aux Normes Du Secteur
Pré-Construits Pour Une Utilisation Rapide Et Efficace
Compatible MAC/PC, entièrement débloqué
Aucune Expertise N'Est Requise; Facile À Suivre
Hunan New Wellful Co.,Ltd. (600975.SS) Bundle
Améliorez vos stratégies d'investissement avec la calculatrice DCF de Hunan New Wellful Co., Ltd. (600975SS)! Explorez les données financières réelles, ajustez les projections et dépenses de croissance et observez instantanément comment ces modifications affectent la valeur intrinsèque de Hunan New Wellful Co., Ltd. (600975SS).
What You Will Receive
- Real Hunan New Wellful Financial Data: Pre-populated with historical and projected figures for accurate analysis.
- Fully Customizable Template: Easily adjust key metrics such as revenue growth, WACC, and EBITDA %.
- Instant Calculations: Watch the intrinsic value of Hunan New Wellful update in real-time as you make changes.
- Professional Valuation Tool: Tailored for investors, analysts, and consultants aiming for precise DCF results.
- User-Friendly Interface: Straightforward layout and clear guidance suitable for users of all skill levels.
Key Features
- Pre-Loaded Data: Hunan New Wellful’s historical financial statements and pre-filled projections.
- Fully Customizable Inputs: Adjust WACC, tax rates, revenue growth, and EBITDA margins as needed.
- Real-Time Calculations: Watch Hunan New Wellful's intrinsic value update instantly.
- Visual Representation: Dashboard graphs present valuation outcomes and essential metrics clearly.
- Designed for Precision: A professional-grade tool suitable for analysts, investors, and finance specialists.
How It Works
- Download the Template: Gain immediate access to the Excel-based Hunan New Wellful Co., Ltd. ([600975SS]) DCF Calculator.
- Input Your Assumptions: Modify the yellow-highlighted cells for growth rates, WACC, margins, and other variables.
- Instant Calculations: The model will automatically refresh to show Hunan New Wellful Co., Ltd.'s ([600975SS]) intrinsic value.
- Test Scenarios: Experiment with different assumptions to assess potential changes in valuation.
- Analyze and Decide: Use the outcomes to inform your investment or financial analysis.
Why Opt for Hunan New Wellful Co., Ltd. Calculator?
- User-Friendly Interface: Tailored for both novice users and seasoned professionals.
- Customizable Parameters: Effortlessly adjust inputs to match your analysis needs.
- Real-Time Updates: Observe immediate changes to Hunan New Wellful’s valuation as you modify inputs.
- Preloaded Data: Comes with Hunan New Wellful’s actual financial metrics for swift evaluations.
- Industry Endorsed: Favored by investors and analysts for making strategic decisions.
Who Should Utilize Hunan New Wellful Co., Ltd. (600975SS)?
- Investors: Empower your investment strategies with an advanced valuation tool tailored for Hunan New Wellful Co., Ltd. (600975SS).
- Financial Analysts: Enhance efficiency with a customizable DCF model specifically designed for analyzing Hunan New Wellful Co., Ltd. (600975SS).
- Consultants: Seamlessly modify the template for impactful client presentations and reports focused on Hunan New Wellful Co., Ltd. (600975SS).
- Finance Enthusiasts: Broaden your knowledge of valuation methods through practical examples associated with Hunan New Wellful Co., Ltd. (600975SS).
- Educators and Students: Incorporate this resource as a hands-on learning tool in finance courses related to Hunan New Wellful Co., Ltd. (600975SS).
Contents of the Template
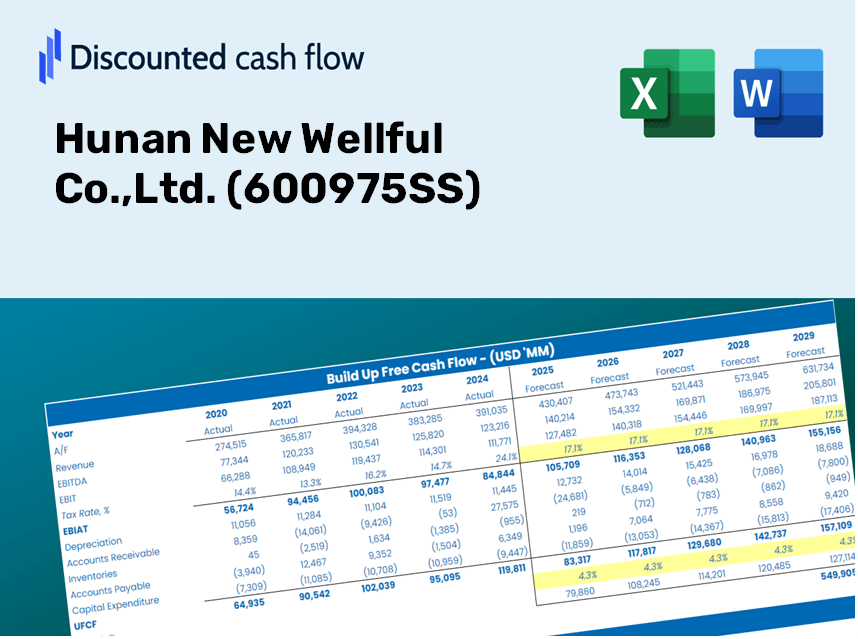
- Operating and Balance Sheet Data: Pre-filled historical data and forecasts for Hunan New Wellful Co., Ltd. (600975SS), including revenue, EBITDA, EBIT, and capital expenditures.
- WACC Calculation: A specific sheet for Weighted Average Cost of Capital (WACC), featuring key parameters like Beta, risk-free rate, and share price.
- DCF Valuation (Unlevered and Levered): Customizable Discounted Cash Flow models that display intrinsic value with comprehensive calculations.
- Financial Statements: Comprehensive financial statements (annual and quarterly) pre-loaded to facilitate analysis.
- Key Ratios: A summary of profitability, leverage, and efficiency ratios for Hunan New Wellful Co., Ltd. (600975SS).
- Dashboard and Charts: A visual overview of valuation results and assumptions to streamline the analysis process.
Disclaimer
All information, articles, and product details provided on this website are for general informational and educational purposes only. We do not claim any ownership over, nor do we intend to infringe upon, any trademarks, copyrights, logos, brand names, or other intellectual property mentioned or depicted on this site. Such intellectual property remains the property of its respective owners, and any references here are made solely for identification or informational purposes, without implying any affiliation, endorsement, or partnership.
We make no representations or warranties, express or implied, regarding the accuracy, completeness, or suitability of any content or products presented. Nothing on this website should be construed as legal, tax, investment, financial, medical, or other professional advice. In addition, no part of this site—including articles or product references—constitutes a solicitation, recommendation, endorsement, advertisement, or offer to buy or sell any securities, franchises, or other financial instruments, particularly in jurisdictions where such activity would be unlawful.
All content is of a general nature and may not address the specific circumstances of any individual or entity. It is not a substitute for professional advice or services. Any actions you take based on the information provided here are strictly at your own risk. You accept full responsibility for any decisions or outcomes arising from your use of this website and agree to release us from any liability in connection with your use of, or reliance upon, the content or products found herein.