
|
Jianmin Pharmaceutical Group Co., Ltd. (600976.SS) Évaluation DCF |
Entièrement Modifiable: Adapté À Vos Besoins Dans Excel Ou Sheets
Conception Professionnelle: Modèles Fiables Et Conformes Aux Normes Du Secteur
Pré-Construits Pour Une Utilisation Rapide Et Efficace
Compatible MAC/PC, entièrement débloqué
Aucune Expertise N'Est Requise; Facile À Suivre
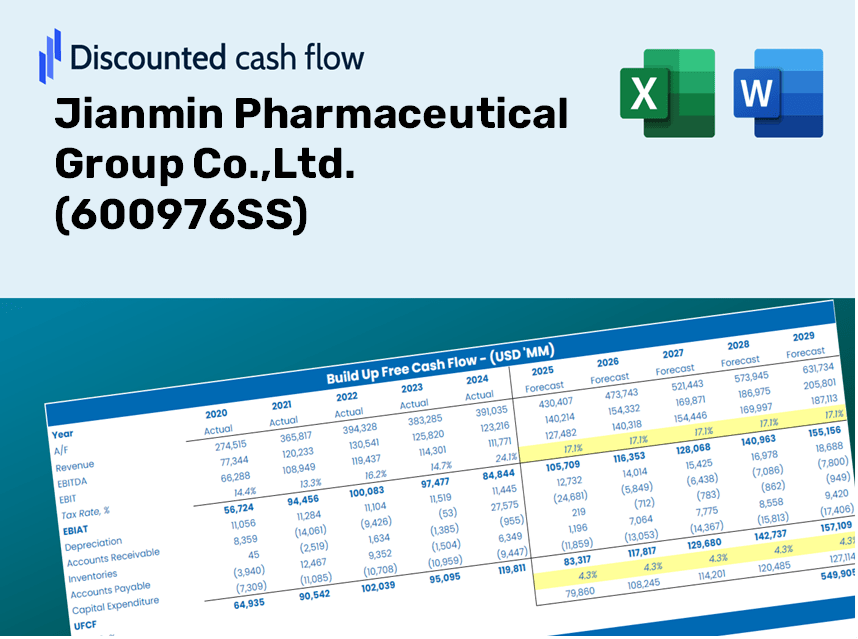
Jianmin Pharmaceutical Group Co.,Ltd. (600976.SS) Bundle
Vous cherchez à déterminer la valeur intrinsèque de Jianmin Pharmaceutical Group Co., Ltd.? Notre calculatrice DCF (600976SS) intègre des données réelles avec des fonctionnalités de personnalisation complètes, vous permettant d'ajuster les prévisions et d'améliorer vos stratégies d'investissement.
Discounted Cash Flow (DCF) - (USD MM)
| Year | AY1 2020 |
AY2 2021 |
AY3 2022 |
AY4 2023 |
AY5 2024 |
FY1 2025 |
FY2 2026 |
FY3 2027 |
FY4 2028 |
FY5 2029 |
|---|---|---|---|---|---|---|---|---|---|---|
| Revenue | 2,456.0 | 3,278.2 | 3,640.8 | 4,213.2 | 3,505.0 | 3,885.7 | 4,307.8 | 4,775.7 | 5,294.5 | 5,869.6 |
| Revenue Growth, % | 0 | 33.48 | 11.06 | 15.72 | -16.81 | 10.86 | 10.86 | 10.86 | 10.86 | 10.86 |
| EBITDA | 178.9 | 288.2 | 481.6 | 615.1 | 251.2 | 396.9 | 440.0 | 487.8 | 540.8 | 599.5 |
| EBITDA, % | 7.28 | 8.79 | 13.23 | 14.6 | 7.17 | 10.21 | 10.21 | 10.21 | 10.21 | 10.21 |
| Depreciation | 30.6 | 50.0 | 54.7 | 40.3 | 70.6 | 56.3 | 62.4 | 69.2 | 76.7 | 85.0 |
| Depreciation, % | 1.25 | 1.53 | 1.5 | 0.95714 | 2.01 | 1.45 | 1.45 | 1.45 | 1.45 | 1.45 |
| EBIT | 148.3 | 238.2 | 426.9 | 574.8 | 180.6 | 340.6 | 377.6 | 418.6 | 464.0 | 514.5 |
| EBIT, % | 6.04 | 7.27 | 11.73 | 13.64 | 5.15 | 8.76 | 8.76 | 8.76 | 8.76 | 8.76 |
| Total Cash | 577.0 | 837.0 | 860.7 | 999.6 | 1,117.4 | 996.8 | 1,105.1 | 1,225.2 | 1,358.2 | 1,505.8 |
| Total Cash, percent | .0 | .0 | .0 | .0 | .0 | .0 | .0 | .0 | .0 | .0 |
| Account Receivables | 595.2 | 696.0 | 909.8 | 1,150.0 | 983.3 | 977.7 | 1,083.9 | 1,201.6 | 1,332.2 | 1,476.9 |
| Account Receivables, % | 24.23 | 21.23 | 24.99 | 27.29 | 28.06 | 25.16 | 25.16 | 25.16 | 25.16 | 25.16 |
| Inventories | 229.0 | 221.7 | 362.9 | 450.8 | 354.3 | 364.2 | 403.8 | 447.6 | 496.3 | 550.2 |
| Inventories, % | 9.32 | 6.76 | 9.97 | 10.7 | 10.11 | 9.37 | 9.37 | 9.37 | 9.37 | 9.37 |
| Accounts Payable | 375.9 | 372.3 | 611.1 | 197.6 | 742.2 | 538.6 | 597.2 | 662.0 | 733.9 | 813.7 |
| Accounts Payable, % | 15.3 | 11.36 | 16.78 | 4.69 | 21.18 | 13.86 | 13.86 | 13.86 | 13.86 | 13.86 |
| Capital Expenditure | -45.6 | -56.0 | -68.0 | -64.5 | -120.3 | -80.8 | -89.5 | -99.3 | -110.1 | -122.0 |
| Capital Expenditure, % | -1.86 | -1.71 | -1.87 | -1.53 | -3.43 | -2.08 | -2.08 | -2.08 | -2.08 | -2.08 |
| Tax Rate, % | 7.75 | 7.75 | 7.75 | 7.75 | 7.75 | 7.75 | 7.75 | 7.75 | 7.75 | 7.75 |
| EBITAT | 139.0 | 201.5 | 397.8 | 524.8 | 166.6 | 310.0 | 343.6 | 381.0 | 422.4 | 468.2 |
| Depreciation | ||||||||||
| Changes in Account Receivables | ||||||||||
| Changes in Inventories | ||||||||||
| Changes in Accounts Payable | ||||||||||
| Capital Expenditure | ||||||||||
| UFCF | -324.3 | 98.3 | 268.3 | -240.9 | 924.7 | 77.7 | 229.3 | 254.2 | 281.8 | 312.4 |
| WACC, % | 5.77 | 5.75 | 5.77 | 5.77 | 5.77 | 5.77 | 5.77 | 5.77 | 5.77 | 5.77 |
| PV UFCF | ||||||||||
| SUM PV UFCF | 954.4 | |||||||||
| Long Term Growth Rate, % | 3.50 | |||||||||
| Free cash flow (T + 1) | 323 | |||||||||
| Terminal Value | 14,269 | |||||||||
| Present Terminal Value | 10,781 | |||||||||
| Enterprise Value | 11,736 | |||||||||
| Net Debt | 6 | |||||||||
| Equity Value | 11,730 | |||||||||
| Diluted Shares Outstanding, MM | 152 | |||||||||
| Equity Value Per Share | 77.08 |
Benefits You Will Receive
- Accurate 600976SS Financial Data: Access both historical and projected figures for precise company valuation.
- Customizable Inputs: Adjust parameters such as WACC, tax rates, revenue growth, and capital expenditures to suit your analysis.
- Real-Time Calculations: Intrinsic value and NPV are computed automatically for your convenience.
- Scenario Analysis: Evaluate various scenarios to forecast Jianmin Pharmaceutical Group Co.,Ltd.'s performance.
- User-Friendly Design: Designed for industry professionals while remaining accessible for newcomers.
Key Features
- Real-Time 600976SS Data: Pre-loaded with Jianmin Pharmaceutical Group's historical financial performance and forward-looking estimates.
- Comprehensive Customizable Inputs: Modify revenue growth rates, profit margins, WACC, tax rates, and capital expenditures to suit your analysis.
- Interactive Valuation Model: Automatically refreshes Net Present Value (NPV) and intrinsic value calculations based on your specified parameters.
- Scenario Analysis: Develop multiple forecasting scenarios to explore various valuation possibilities.
- Intuitive User Interface: Easy-to-use and thoughtfully structured for both seasoned professionals and newcomers.
How It Works
- 1. Access the Template: Download and open the Excel file containing Jianmin Pharmaceutical Group Co.,Ltd.'s preloaded data.
- 2. Modify Assumptions: Adjust key parameters such as growth rates, WACC, and capital expenditures as needed.
- 3. Observe Results Instantly: The DCF model automatically calculates the intrinsic value and NPV based on your inputs.
- 4. Explore Scenarios: Evaluate various forecasts to understand different valuation possibilities.
- 5. Utilize with Confidence: Deliver professional valuation insights to enhance your decision-making for (600976SS).
Why Choose This Calculator?
- User-Friendly Interface: Perfect for both novice and seasoned users.
- Customizable Inputs: Adjust parameters to tailor your financial analysis.
- Real-Time Valuation: Observe instant updates to Jianmin Pharmaceutical Group Co.,Ltd. (600976SS) as you modify inputs.
- Preloaded Financial Data: Comes equipped with Jianmin's latest financial information for efficient assessments.
- Relied Upon by Experts: Favored by financial analysts and investors for making strategic decisions.
Who Can Benefit from Jianmin Pharmaceutical Group Co., Ltd. (600976SS)?
- Investors: Gain insights and make informed investment choices with our advanced analysis tools.
- Financial Analysts: Streamline your workflow with our customizable financial models tailored for the pharmaceutical industry.
- Consultants: Effortlessly modify reports and presentations to suit client needs using our ready-made templates.
- Pharmaceutical Enthusiasts: Enhance your knowledge of the sector with practical examples and in-depth analysis.
- Educators and Students: Utilize our resources as a valuable educational tool in pharmacological and financial studies.
Contents of the Template
- Thorough DCF Model: An editable template featuring intricate valuation calculations.
- Real-Time Data: Historical and projected financial data for Jianmin Pharmaceutical Group Co., Ltd. preloaded for analysis.
- Adjustable Assumptions: Modify WACC, growth rates, and tax considerations to explore different scenarios.
- Financial Statements: Comprehensive annual and quarterly reports for enhanced insights.
- Essential Ratios: Integrated analysis for assessing profitability, efficiency, and leverage.
- User-Friendly Dashboard: Visual charts and tables presenting clear, actionable results.
Disclaimer
All information, articles, and product details provided on this website are for general informational and educational purposes only. We do not claim any ownership over, nor do we intend to infringe upon, any trademarks, copyrights, logos, brand names, or other intellectual property mentioned or depicted on this site. Such intellectual property remains the property of its respective owners, and any references here are made solely for identification or informational purposes, without implying any affiliation, endorsement, or partnership.
We make no representations or warranties, express or implied, regarding the accuracy, completeness, or suitability of any content or products presented. Nothing on this website should be construed as legal, tax, investment, financial, medical, or other professional advice. In addition, no part of this site—including articles or product references—constitutes a solicitation, recommendation, endorsement, advertisement, or offer to buy or sell any securities, franchises, or other financial instruments, particularly in jurisdictions where such activity would be unlawful.
All content is of a general nature and may not address the specific circumstances of any individual or entity. It is not a substitute for professional advice or services. Any actions you take based on the information provided here are strictly at your own risk. You accept full responsibility for any decisions or outcomes arising from your use of this website and agree to release us from any liability in connection with your use of, or reliance upon, the content or products found herein.