
|
Guizhou BC & TV Information Network co., Ltd (600996.SS) Valation DCF |
Entièrement Modifiable: Adapté À Vos Besoins Dans Excel Ou Sheets
Conception Professionnelle: Modèles Fiables Et Conformes Aux Normes Du Secteur
Pré-Construits Pour Une Utilisation Rapide Et Efficace
Compatible MAC/PC, entièrement débloqué
Aucune Expertise N'Est Requise; Facile À Suivre
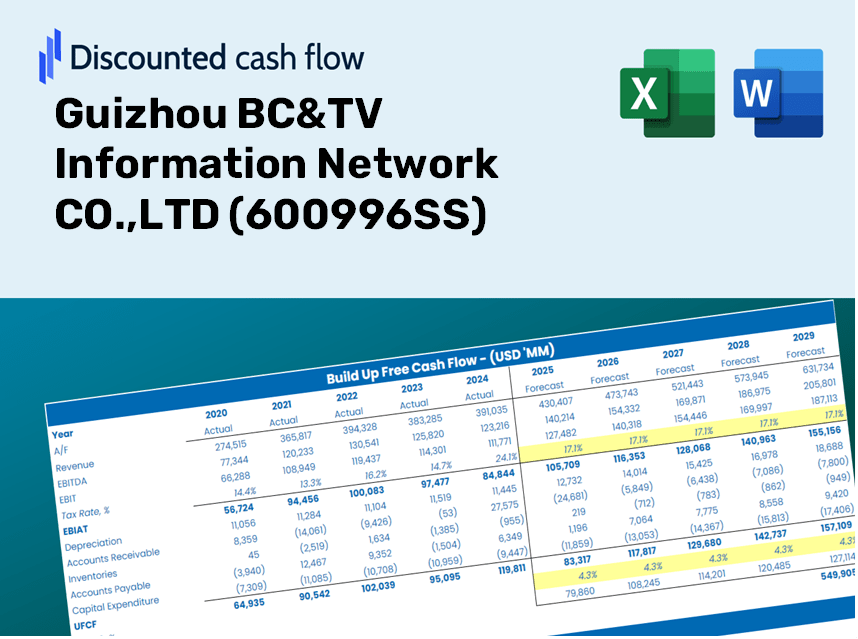
Guizhou BC&TV Information Network CO.,LTD (600996.SS) Bundle
Découvrez le véritable potentiel de Guizhou BC & TV Information Network CO., Ltd (600996SS) avec notre calculatrice avancée DCF! Ajustez les hypothèses clés, explorez divers scénarios et évaluez comment les modifications affectent Guizhou BC & TV Information Network CO., LTD (600996SS) Valation - Tout dans un modèle Excel pratique.
What You Will Receive
- Comprehensive Guizhou BC&TV Financials: Access to both historical and projected data for precise valuation.
- Customizable Inputs: Adjust parameters like WACC, tax rates, revenue growth, and capital expenditures.
- Dynamic Calculations: Intrinsic value and NPV are computed in real-time.
- Scenario Analysis: Examine various scenarios to assess the future potential of Guizhou BC&TV.
- User-Friendly Design: Crafted for professionals while being easy to navigate for newcomers.
Highlighted Features
- Authentic Guizhou BC&TV Data: Pre-filled with historical financial metrics and proactive forecasts for Guizhou BC&TV Information Network CO.,LTD (600996SS).
- Completely Customizable Inputs: Modify revenue growth rates, profit margins, cost of capital, tax assumptions, and capital expenditures.
- Adaptive Valuation Framework: Automatic recalculations of Net Present Value (NPV) and intrinsic value tailored to your inputs.
- Scenario Analysis: Develop multiple forecasting scenarios to evaluate various valuation possibilities.
- Intuitive User Interface: Designed to be clear and accessible, catering to both experienced professionals and newcomers.
How It Functions
- Step 1: Download the prebuilt Excel template containing Guizhou BC&TV Information Network CO.,LTD’s (600996SS) data.
- Step 2: Review the pre-filled sheets to familiarize yourself with the essential metrics.
- Step 3: Adjust forecasts and assumptions in the editable yellow cells (WACC, growth, margins).
- Step 4: Instantly see updated results, including the intrinsic value of Guizhou BC&TV Information Network CO.,LTD (600996SS).
- Step 5: Utilize the outputs to make informed investment decisions or create reports.
Why Choose Guizhou BC&TV Information Network CO.,LTD (600996SS)?
- Data Integrity: Utilizes verified financial metrics for reliable results.
- Adaptability: Tailored for users to easily adjust and explore different scenarios.
- Efficiency: Avoid the complexities of creating a financial model from the ground up.
- High Standards: Crafted with a focus on precision and usability suitable for top executives.
- Intuitive Design: Simple interface, perfect for users with varying levels of financial expertise.
Who Should Use This Product?
- Individual Investors: Gain insights to make informed decisions regarding buying or selling shares in Guizhou BC&TV Information Network CO.,LTD (600996SS).
- Financial Analysts: Enhance valuation processes with comprehensive, ready-made financial models applicable to (600996SS).
- Consultants: Provide clients with precise and timely valuation insights related to Guizhou BC&TV Information Network CO.,LTD (600996SS).
- Business Owners: Learn how major companies like Guizhou BC&TV Information Network CO.,LTD (600996SS) are valued, informing your own business strategies.
- Finance Students: Master valuation techniques using real-world examples and data from (600996SS).
Contents of the Template
- Preloaded 600996SS Data: Historical and forecasted financial metrics, including revenue, EBIT, and capital expenditures.
- DCF and WACC Models: Professional-grade worksheets for determining intrinsic value and Weighted Average Cost of Capital.
- Editable Inputs: Cells highlighted in yellow for modifying revenue growth, tax rates, and discount rates.
- Financial Statements: Detailed annual and quarterly financial statements for in-depth analysis.
- Key Ratios: Metrics for profitability, leverage, and efficiency to assess overall performance.
- Dashboard and Charts: Visual representations of valuation results and underlying assumptions.
Disclaimer
All information, articles, and product details provided on this website are for general informational and educational purposes only. We do not claim any ownership over, nor do we intend to infringe upon, any trademarks, copyrights, logos, brand names, or other intellectual property mentioned or depicted on this site. Such intellectual property remains the property of its respective owners, and any references here are made solely for identification or informational purposes, without implying any affiliation, endorsement, or partnership.
We make no representations or warranties, express or implied, regarding the accuracy, completeness, or suitability of any content or products presented. Nothing on this website should be construed as legal, tax, investment, financial, medical, or other professional advice. In addition, no part of this site—including articles or product references—constitutes a solicitation, recommendation, endorsement, advertisement, or offer to buy or sell any securities, franchises, or other financial instruments, particularly in jurisdictions where such activity would be unlawful.
All content is of a general nature and may not address the specific circumstances of any individual or entity. It is not a substitute for professional advice or services. Any actions you take based on the information provided here are strictly at your own risk. You accept full responsibility for any decisions or outcomes arising from your use of this website and agree to release us from any liability in connection with your use of, or reliance upon, the content or products found herein.