
|
Jinneng Holding Shanxi Coal Industry Co., Ltd. (601001.SS) Évaluation DCF |
Entièrement Modifiable: Adapté À Vos Besoins Dans Excel Ou Sheets
Conception Professionnelle: Modèles Fiables Et Conformes Aux Normes Du Secteur
Pré-Construits Pour Une Utilisation Rapide Et Efficace
Compatible MAC/PC, entièrement débloqué
Aucune Expertise N'Est Requise; Facile À Suivre
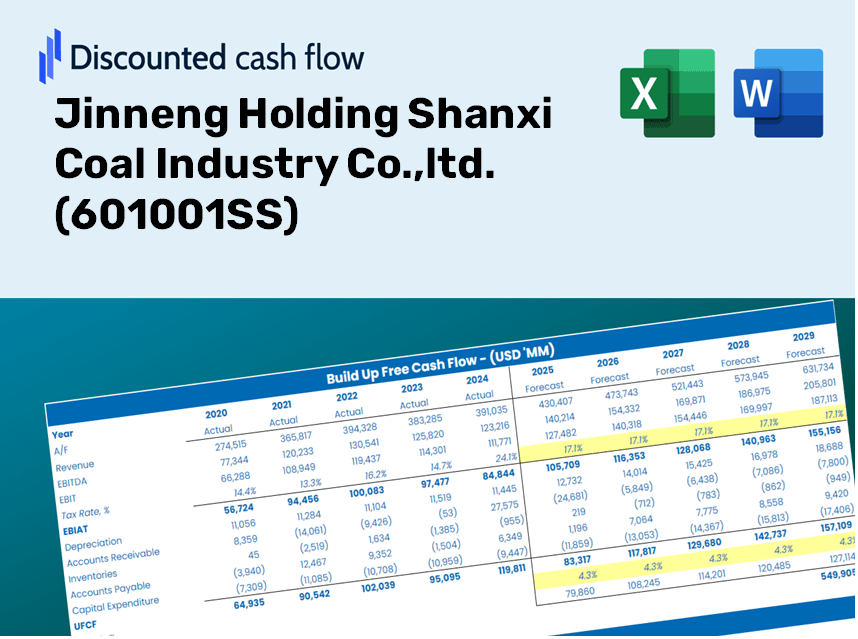
Jinneng Holding Shanxi Coal Industry Co.,ltd. (601001.SS) Bundle
Gardez un aperçu de votre analyse de l'évaluation de votre Jinneng Holding Holding Shanxi Coal Industry Co., Ltd. (601001SS) en utilisant notre calculatrice sophistiquée DCF! Avec des données en temps réel pour (601001SS), ce modèle Excel vous permet d'ajuster les prévisions et les hypothèses pour déterminer avec précision la valeur intrinsèque de Jinneng Holding Shanxi Coal Industry Co., Ltd.
Discounted Cash Flow (DCF) - (USD MM)
| Year | AY1 2020 |
AY2 2021 |
AY3 2022 |
AY4 2023 |
AY5 2024 |
FY1 2025 |
FY2 2026 |
FY3 2027 |
FY4 2028 |
FY5 2029 |
|---|---|---|---|---|---|---|---|---|---|---|
| Revenue | 10,905.0 | 18,265.1 | 16,081.7 | 15,341.6 | 15,032.5 | 14,793.6 | 14,558.4 | 14,326.9 | 14,099.1 | 13,875.0 |
| Revenue Growth, % | 0 | 67.49 | -11.95 | -4.6 | -2.01 | -1.59 | -1.59 | -1.59 | -1.59 | -1.59 |
| EBITDA | 3,266.7 | 8,587.0 | 7,019.9 | 6,460.8 | 6,343.4 | 6,063.3 | 5,966.9 | 5,872.0 | 5,778.7 | 5,686.8 |
| EBITDA, % | 29.96 | 47.01 | 43.65 | 42.11 | 42.2 | 40.99 | 40.99 | 40.99 | 40.99 | 40.99 |
| Depreciation | 998.7 | 1,060.7 | 1,202.7 | 1,174.2 | 1,317.7 | 1,149.8 | 1,131.6 | 1,113.6 | 1,095.9 | 1,078.4 |
| Depreciation, % | 9.16 | 5.81 | 7.48 | 7.65 | 8.77 | 7.77 | 7.77 | 7.77 | 7.77 | 7.77 |
| EBIT | 2,268.1 | 7,526.3 | 5,817.2 | 5,286.6 | 5,025.7 | 4,913.5 | 4,835.4 | 4,758.5 | 4,682.8 | 4,608.4 |
| EBIT, % | 20.8 | 41.21 | 36.17 | 34.46 | 33.43 | 33.21 | 33.21 | 33.21 | 33.21 | 33.21 |
| Total Cash | 9,233.1 | 16,386.4 | 18,815.8 | 15,208.9 | 16,610.3 | 14,010.0 | 13,787.3 | 13,568.1 | 13,352.4 | 13,140.1 |
| Total Cash, percent | .0 | .0 | .0 | .0 | .0 | .0 | .0 | .0 | .0 | .0 |
| Account Receivables | 925.6 | 1,157.8 | 1,211.4 | 1,765.8 | 493.2 | 1,099.2 | 1,081.7 | 1,064.5 | 1,047.6 | 1,030.9 |
| Account Receivables, % | 8.49 | 6.34 | 7.53 | 11.51 | 3.28 | 7.43 | 7.43 | 7.43 | 7.43 | 7.43 |
| Inventories | 549.6 | 356.7 | 328.9 | 343.0 | 454.2 | 422.9 | 416.2 | 409.6 | 403.1 | 396.7 |
| Inventories, % | 5.04 | 1.95 | 2.05 | 2.24 | 3.02 | 2.86 | 2.86 | 2.86 | 2.86 | 2.86 |
| Accounts Payable | 4,764.3 | 5,813.7 | 5,636.1 | 4,813.5 | 4,159.3 | 5,018.2 | 4,938.5 | 4,859.9 | 4,782.7 | 4,706.6 |
| Accounts Payable, % | 43.69 | 31.83 | 35.05 | 31.38 | 27.67 | 33.92 | 33.92 | 33.92 | 33.92 | 33.92 |
| Capital Expenditure | -791.8 | -481.4 | -594.1 | -838.9 | -919.9 | -744.9 | -733.1 | -721.4 | -710.0 | -698.7 |
| Capital Expenditure, % | -7.26 | -2.64 | -3.69 | -5.47 | -6.12 | -5.04 | -5.04 | -5.04 | -5.04 | -5.04 |
| Tax Rate, % | 46.86 | 46.86 | 46.86 | 46.86 | 46.86 | 46.86 | 46.86 | 46.86 | 46.86 | 46.86 |
| EBITAT | 944.9 | 4,236.6 | 2,955.7 | 2,973.6 | 2,670.9 | 2,536.9 | 2,496.5 | 2,456.8 | 2,417.8 | 2,379.3 |
| Depreciation | ||||||||||
| Changes in Account Receivables | ||||||||||
| Changes in Inventories | ||||||||||
| Changes in Accounts Payable | ||||||||||
| Capital Expenditure | ||||||||||
| UFCF | 4,440.9 | 5,825.9 | 3,361.0 | 1,917.7 | 3,575.8 | 3,226.0 | 2,839.4 | 2,794.3 | 2,749.8 | 2,706.1 |
| WACC, % | 5.37 | 5.51 | 5.46 | 5.51 | 5.48 | 5.47 | 5.47 | 5.47 | 5.47 | 5.47 |
| PV UFCF | ||||||||||
| SUM PV UFCF | 12,289.8 | |||||||||
| Long Term Growth Rate, % | 0.50 | |||||||||
| Free cash flow (T + 1) | 2,720 | |||||||||
| Terminal Value | 54,763 | |||||||||
| Present Terminal Value | 41,968 | |||||||||
| Enterprise Value | 54,258 | |||||||||
| Net Debt | -14,993 | |||||||||
| Equity Value | 69,251 | |||||||||
| Diluted Shares Outstanding, MM | 1,671 | |||||||||
| Equity Value Per Share | 41.43 |
Benefits You Will Receive
- Adjustable Forecast Parameters: Effortlessly modify key assumptions (growth %, margins, WACC) to explore various scenarios.
- Relevant Financial Data: Jinneng Holding Shanxi Coal Industry Co., Ltd.'s (601001SS) financial information pre-loaded to facilitate your analysis.
- Instant DCF Outcomes: The template automatically computes Net Present Value (NPV) and intrinsic value for you.
- Tailored and Professional: A sleek Excel model designed to fit your valuation requirements.
- Designed for Analysts and Investors: Perfect for testing projections, confirming strategies, and enhancing efficiency.
Key Features
- Accurate Financial Data for Jinneng Holding: Gain access to reliable historical figures and projected financials.
- Adjustable Forecast Parameters: Modify highlighted cells for WACC, growth rates, and profit margins.
- Real-Time Calculations: Instant updates for DCF, Net Present Value (NPV), and cash flow assessments.
- Intuitive Visual Dashboard: User-friendly charts and summaries to easily interpret your valuation outcomes.
- Designed for All Skill Levels: A straightforward layout tailored for investors, CFOs, and advisors alike.
How It Works
- Step 1: Download the prebuilt Excel template featuring Jinneng Holding Shanxi Coal Industry Co., Ltd.'s (601001SS) data.
- Step 2: Analyze the pre-filled sheets to grasp the essential metrics.
- Step 3: Adjust forecasts and assumptions in the editable yellow cells (WACC, growth, margins).
- Step 4: View immediately updated results, including Jinneng Holding’s intrinsic value.
- Step 5: Make informed investment decisions or prepare reports based on the outputs.
Why Choose Jinneng Holding Shanxi Coal Industry Co., Ltd. (601001SS)?
- Time Efficient: Skip the hassle of building a financial model from the ground up – it's ready for immediate use.
- Enhanced Precision: Accurate financial metrics and formulas minimize valuation errors.
- Completely Customizable: Adjust the model to fit your specific assumptions and forecasts.
- User-Friendly: Intuitive charts and outputs simplify data interpretation.
- Relied Upon by Professionals: Crafted for those who prioritize accuracy and practicality in their work.
Who Should Utilize This Product?
- Individual Investors: Make informed decisions regarding the purchase or sale of Jinneng Holding Shanxi Coal Industry Co., Ltd. (601001SS) stock.
- Financial Analysts: Enhance valuation processes with ready-to-implement financial models specific to Jinneng Holding.
- Consultants: Provide clients with precise and timely valuation insights about Jinneng Holding Shanxi Coal Industry Co., Ltd. (601001SS).
- Business Owners: Gain insights into the valuation of major companies like Jinneng Holding to inform your business strategy.
- Finance Students: Study valuation methodologies using real-world data and case studies related to Jinneng Holding Shanxi Coal Industry Co., Ltd. (601001SS).
What the Template Contains
- Operating and Balance Sheet Data: Pre-filled historical data and forecasts for Jinneng Holding Shanxi Coal Industry Co., Ltd. (601001SS), including revenue, EBITDA, EBIT, and capital expenditures.
- WACC Calculation: A dedicated sheet for the Weighted Average Cost of Capital (WACC), featuring parameters such as Beta, risk-free rate, and share price.
- DCF Valuation (Unlevered and Levered): Customizable Discounted Cash Flow models that display intrinsic value with comprehensive calculations.
- Financial Statements: Pre-loaded annual and quarterly financial statements to facilitate in-depth analysis.
- Key Ratios: Includes profitability, leverage, and efficiency ratios specific to Jinneng Holding Shanxi Coal Industry Co., Ltd. (601001SS).
- Dashboard and Charts: A visual overview of valuation outputs and assumptions to simplify result analysis.
Disclaimer
All information, articles, and product details provided on this website are for general informational and educational purposes only. We do not claim any ownership over, nor do we intend to infringe upon, any trademarks, copyrights, logos, brand names, or other intellectual property mentioned or depicted on this site. Such intellectual property remains the property of its respective owners, and any references here are made solely for identification or informational purposes, without implying any affiliation, endorsement, or partnership.
We make no representations or warranties, express or implied, regarding the accuracy, completeness, or suitability of any content or products presented. Nothing on this website should be construed as legal, tax, investment, financial, medical, or other professional advice. In addition, no part of this site—including articles or product references—constitutes a solicitation, recommendation, endorsement, advertisement, or offer to buy or sell any securities, franchises, or other financial instruments, particularly in jurisdictions where such activity would be unlawful.
All content is of a general nature and may not address the specific circumstances of any individual or entity. It is not a substitute for professional advice or services. Any actions you take based on the information provided here are strictly at your own risk. You accept full responsibility for any decisions or outcomes arising from your use of this website and agree to release us from any liability in connection with your use of, or reliance upon, the content or products found herein.