
|
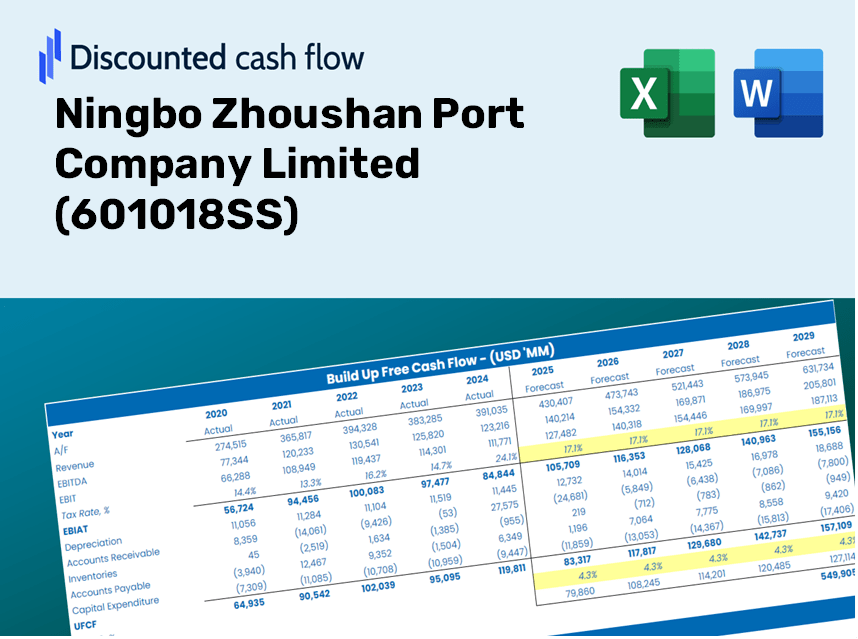
Ningbo Zhoushan Port Company Limited (601018.SS) Évaluation DCF |
Entièrement Modifiable: Adapté À Vos Besoins Dans Excel Ou Sheets
Conception Professionnelle: Modèles Fiables Et Conformes Aux Normes Du Secteur
Pré-Construits Pour Une Utilisation Rapide Et Efficace
Compatible MAC/PC, entièrement débloqué
Aucune Expertise N'Est Requise; Facile À Suivre
Ningbo Zhoushan Port Company Limited (601018.SS) Bundle
Vous cherchez à déterminer la valeur intrinsèque de Ningbo Zousehan Port Company Limited? Notre calculatrice DCF (601018SS) intègre des données de marché réelles avec des fonctionnalités de personnalisation complètes, vous permettant d'affiner vos projections et d'améliorer vos choix d'investissement.
What You Will Receive
- Authentic Financial Data for Ningbo Zhoushan Port: Pre-loaded with the company's historical and forecasted financials for accurate analysis.
- Customizable Template: Easily adjust key metrics such as revenue growth, WACC, and EBITDA percentage.
- Instant Calculations: Watch the intrinsic value of Ningbo Zhoushan Port Company Limited (601018SS) refresh immediately based on your adjustments.
- Professional Valuation Toolkit: Tailored for investors, analysts, and consultants aiming for precise DCF evaluations.
- Intuitive Interface: User-friendly layout and straightforward guidelines suitable for all skill levels.
Key Features
- Pre-Loaded Data: Historical financial statements and forecasts specifically for Ningbo Zhoushan Port Company Limited (601018SS).
- Fully Adjustable Inputs: Modify WACC, tax rates, revenue growth, and EBITDA margins as per your analysis needs.
- Instant Results: Observe the intrinsic value of Ningbo Zhoushan Port Company Limited (601018SS) recalculating in real time.
- Clear Visual Outputs: Interactive dashboard charts present valuation outcomes and crucial metrics.
- Built for Accuracy: A professional-grade tool crafted for analysts, investors, and finance professionals.
How It Functions
- Download the Template: Gain immediate access to the Excel-based Ningbo Zhoushan Port Company Limited (601018SS) DCF Calculator.
- Enter Your Parameters: Modify the yellow-highlighted cells for growth rates, WACC, profit margins, and other key metrics.
- Instant Updates: The model automatically recalculates the intrinsic value of Ningbo Zhoushan Port Company Limited (601018SS).
- Explore Scenarios: Experiment with various assumptions to assess potential changes in valuation.
- Analyze and Make Decisions: Utilize the outcomes to inform your investment or financial strategy.
Why Choose This Calculator for Ningbo Zhoushan Port Company Limited (601018SS)?
- Tailored for Industry Experts: A specialized tool utilized by analysts, CFOs, and consultants entrenched in port operations.
- Accurate Data Integration: Historical and forecasted financial data for Ningbo Zhoushan Port preloaded for enhanced reliability.
- Comprehensive Scenario Analysis: Effortlessly test various forecasts and assumptions to evaluate potential outcomes.
- Clear and Concise Results: Instantly computes intrinsic value, NPV, and essential financial metrics.
- User-Friendly Design: Detailed step-by-step guidance to simplify your calculation process.
Who Can Benefit from This Product?
- Investors: Evaluate the valuation of Ningbo Zhoushan Port Company Limited (601018SS) before making stock trades.
- CFOs and Financial Analysts: Optimize valuation workflows and validate financial forecasts.
- Startup Founders: Gain insights into how prominent public firms like Ningbo Zhoushan Port Company Limited (601018SS) are appraised.
- Consultants: Create in-depth valuation reports for your clients.
- Students and Educators: Utilize real market data to practice and teach valuation methods.
Contents of the Template
- Pre-Filled Data: Contains Ningbo Zhoushan Port's historical financial data and forecasts.
- Discounted Cash Flow Model: A fully editable DCF valuation model with automatic calculations.
- Weighted Average Cost of Capital (WACC): A specific sheet designed to calculate WACC based on user-defined inputs.
- Key Financial Ratios: Evaluate Ningbo Zhoushan Port’s profitability, efficiency, and capital structure.
- Customizable Inputs: Easily modify revenue growth, margins, and tax rates.
- Comprehensive Dashboard: Visual representations and tables summarizing essential valuation outputs.
Disclaimer
All information, articles, and product details provided on this website are for general informational and educational purposes only. We do not claim any ownership over, nor do we intend to infringe upon, any trademarks, copyrights, logos, brand names, or other intellectual property mentioned or depicted on this site. Such intellectual property remains the property of its respective owners, and any references here are made solely for identification or informational purposes, without implying any affiliation, endorsement, or partnership.
We make no representations or warranties, express or implied, regarding the accuracy, completeness, or suitability of any content or products presented. Nothing on this website should be construed as legal, tax, investment, financial, medical, or other professional advice. In addition, no part of this site—including articles or product references—constitutes a solicitation, recommendation, endorsement, advertisement, or offer to buy or sell any securities, franchises, or other financial instruments, particularly in jurisdictions where such activity would be unlawful.
All content is of a general nature and may not address the specific circumstances of any individual or entity. It is not a substitute for professional advice or services. Any actions you take based on the information provided here are strictly at your own risk. You accept full responsibility for any decisions or outcomes arising from your use of this website and agree to release us from any liability in connection with your use of, or reliance upon, the content or products found herein.