
|
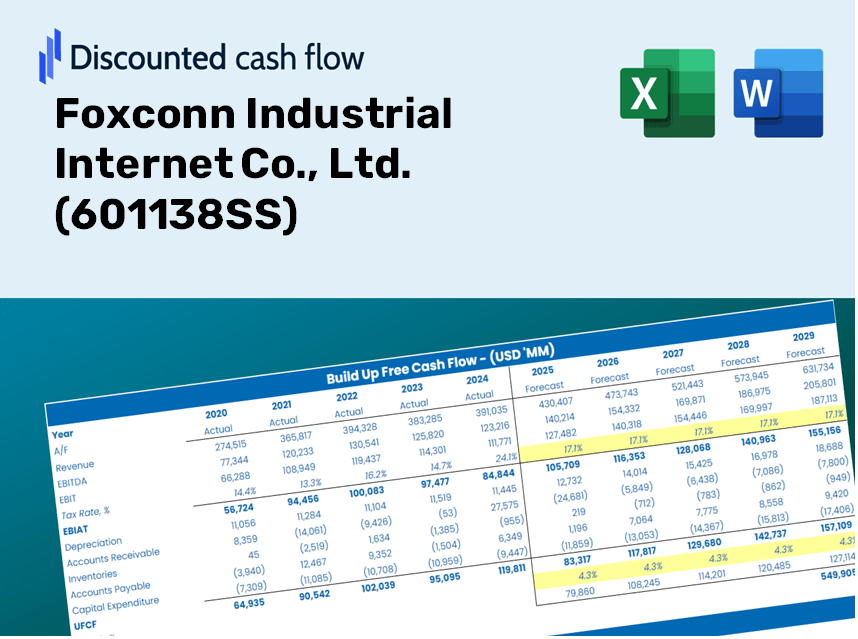
Foxconn Industrial Internet Co., Ltd. (601138.SS) Évaluation DCF |
Entièrement Modifiable: Adapté À Vos Besoins Dans Excel Ou Sheets
Conception Professionnelle: Modèles Fiables Et Conformes Aux Normes Du Secteur
Pré-Construits Pour Une Utilisation Rapide Et Efficace
Compatible MAC/PC, entièrement débloqué
Aucune Expertise N'Est Requise; Facile À Suivre
Foxconn Industrial Internet Co., Ltd. (601138.SS) Bundle
Découvrez la vraie valeur de Foxconn Industrial Internet Co., Ltd. (601138SS) avec notre calculatrice avancée DCF! Ajustez les hypothèses essentielles, explorez divers scénarios et évaluez comment différents facteurs influencent l'évaluation de Foxconn Industrial Internet Co., Ltd. (601138SS) - le tout dans un modèle Excel pratique.
Discounted Cash Flow (DCF) - (USD MM)
| Year | AY1 2020 |
AY2 2021 |
AY3 2022 |
AY4 2023 |
AY5 2024 |
FY1 2025 |
FY2 2026 |
FY3 2027 |
FY4 2028 |
FY5 2029 |
|---|---|---|---|---|---|---|---|---|---|---|
| Revenue | 431,785.9 | 439,557.2 | 511,849.6 | 476,340.1 | 609,135.4 | 668,811.2 | 734,333.4 | 806,274.6 | 885,263.7 | 971,991.3 |
| Revenue Growth, % | 0 | 1.8 | 16.45 | -6.94 | 27.88 | 9.8 | 9.8 | 9.8 | 9.8 | 9.8 |
| EBITDA | 20,991.6 | 22,259.0 | 22,521.1 | 25,938.6 | 29,686.6 | 32,964.9 | 36,194.4 | 39,740.3 | 43,633.6 | 47,908.3 |
| EBITDA, % | 4.86 | 5.06 | 4.4 | 5.45 | 4.87 | 4.93 | 4.93 | 4.93 | 4.93 | 4.93 |
| Depreciation | 2,433.0 | 2,515.7 | 3,220.2 | 4,449.5 | 3,956.4 | 4,479.1 | 4,917.9 | 5,399.7 | 5,928.7 | 6,509.5 |
| Depreciation, % | 0.56346 | 0.57232 | 0.62914 | 0.93409 | 0.64952 | 0.66971 | 0.66971 | 0.66971 | 0.66971 | 0.66971 |
| EBIT | 18,558.6 | 19,743.3 | 19,300.9 | 21,489.2 | 25,730.1 | 28,485.9 | 31,276.6 | 34,340.7 | 37,705.0 | 41,398.8 |
| EBIT, % | 4.3 | 4.49 | 3.77 | 4.51 | 4.22 | 4.26 | 4.26 | 4.26 | 4.26 | 4.26 |
| Total Cash | 78,056.6 | 82,877.1 | 69,445.5 | 83,795.6 | 72,698.4 | 107,044.7 | 117,531.6 | 129,046.0 | 141,688.3 | 155,569.3 |
| Total Cash, percent | .0 | .0 | .0 | .0 | .0 | .0 | .0 | .0 | .0 | .0 |
| Account Receivables | 86,827.6 | 87,033.8 | 97,689.8 | 88,474.2 | 111,670.9 | 128,279.8 | 140,847.2 | 154,645.7 | 169,796.0 | 186,430.6 |
| Account Receivables, % | 20.11 | 19.8 | 19.09 | 18.57 | 18.33 | 19.18 | 19.18 | 19.18 | 19.18 | 19.18 |
| Inventories | 45,353.9 | 71,927.8 | 77,321.8 | 76,683.3 | 85,265.7 | 96,402.6 | 105,847.0 | 116,216.6 | 127,602.1 | 140,103.0 |
| Inventories, % | 10.5 | 16.36 | 15.11 | 16.1 | 14 | 14.41 | 14.41 | 14.41 | 14.41 | 14.41 |
| Accounts Payable | 62,244.8 | 71,986.7 | 69,278.9 | 75,028.3 | 93,834.5 | 100,968.2 | 110,859.9 | 121,720.6 | 133,645.3 | 146,738.3 |
| Accounts Payable, % | 14.42 | 16.38 | 13.54 | 15.75 | 15.4 | 15.1 | 15.1 | 15.1 | 15.1 | 15.1 |
| Capital Expenditure | -3,606.3 | -6,035.3 | -8,093.3 | -9,189.7 | -11,280.9 | -10,126.6 | -11,118.7 | -12,208.0 | -13,404.0 | -14,717.1 |
| Capital Expenditure, % | -0.8352 | -1.37 | -1.58 | -1.93 | -1.85 | -1.51 | -1.51 | -1.51 | -1.51 | -1.51 |
| Tax Rate, % | 10.62 | 10.62 | 10.62 | 10.62 | 10.62 | 10.62 | 10.62 | 10.62 | 10.62 | 10.62 |
| EBITAT | 16,382.7 | 17,701.5 | 17,640.0 | 19,552.6 | 22,998.8 | 25,620.3 | 28,130.3 | 30,886.1 | 33,912.0 | 37,234.3 |
| Depreciation | ||||||||||
| Changes in Account Receivables | ||||||||||
| Changes in Inventories | ||||||||||
| Changes in Accounts Payable | ||||||||||
| Capital Expenditure | ||||||||||
| UFCF | -54,727.3 | -2,856.4 | -5,990.7 | 30,415.7 | 2,701.6 | -639.5 | 9,809.4 | 10,770.4 | 11,825.6 | 12,984.1 |
| WACC, % | 10.31 | 10.31 | 10.31 | 10.31 | 10.31 | 10.31 | 10.31 | 10.31 | 10.31 | 10.31 |
| PV UFCF | ||||||||||
| SUM PV UFCF | 31,439.3 | |||||||||
| Long Term Growth Rate, % | 3.00 | |||||||||
| Free cash flow (T + 1) | 13,374 | |||||||||
| Terminal Value | 182,889 | |||||||||
| Present Terminal Value | 111,961 | |||||||||
| Enterprise Value | 143,400 | |||||||||
| Net Debt | -27,785 | |||||||||
| Equity Value | 171,185 | |||||||||
| Diluted Shares Outstanding, MM | 19,843 | |||||||||
| Equity Value Per Share | 8.63 |
What You'll Receive
- Customizable Excel Template: A fully adjustable Excel-based DCF Calculator featuring pre-filled financial data for Foxconn Industrial Internet Co., Ltd. (601138SS).
- Accurate Historical Data: Access to past performance metrics and forward-looking projections (displayed in the highlighted cells).
- Flexible Forecasting: Adjust key assumptions such as revenue growth, EBITDA %, and WACC as needed.
- Instant Calculations: Quickly observe how your inputs affect the valuation of Foxconn Industrial Internet Co., Ltd. (601138SS).
- Professional Resource: Designed specifically for investors, CFOs, consultants, and finance professionals.
- Intuitive Design: Organized for simplicity and user-friendliness, complete with step-by-step guidelines.
Key Features
- Comprehensive DCF Calculator: Offers both unlevered and levered DCF valuation models tailored for Foxconn Industrial Internet Co., Ltd. (601138SS).
- WACC Calculator: Ready-to-use Weighted Average Cost of Capital template with adjustable parameters.
- Customizable Forecast Assumptions: Easily update growth rates, capital expenditures, and discount rates to suit your analysis.
- Integrated Financial Ratios: Assess profitability, leverage, and efficiency ratios specifically for Foxconn Industrial Internet Co., Ltd. (601138SS).
- Visual Dashboard and Charts: Graphical representations that highlight essential valuation metrics for straightforward evaluation.
How It Functions
- Download: Get the pre-prepared Excel file containing Foxconn Industrial Internet Co., Ltd.'s financial data.
- Customize: Modify key forecasts such as revenue growth, EBITDA %, and WACC.
- Update Automatically: The intrinsic value and NPV calculations refresh in real-time.
- Test Scenarios: Develop various projections and instantly compare the results.
- Make Decisions: Utilize the valuation findings to inform your investment strategy.
Why Opt for This Calculator?
- User-Friendly and Accessible: Tailored for both novices and seasoned professionals.
- Customizable Inputs: Effortlessly adjust parameters to align with your analysis.
- Real-Time Feedback: Observe immediate effects on Foxconn Industrial Internet Co., Ltd.’s valuation as you modify inputs.
- Preconfigured Data: Comes preloaded with the latest financial information for Foxconn Industrial Internet Co., Ltd. for swift evaluations.
- Relied Upon by Experts: A trusted tool among investors and analysts for making well-informed choices.
Who Can Benefit from This Product?
- Engineering Students: Explore advanced manufacturing techniques and apply them to real-world cases.
- Researchers: Utilize industry-specific models in your studies or innovative projects.
- Investors: Evaluate your investment strategies and analyze performance metrics for Foxconn Industrial Internet Co., Ltd. (601138SS).
- Market Analysts: Enhance your analysis process with a customizable model tailored for industrial Internet applications.
- Entrepreneurs: Understand how large-scale industrial companies like Foxconn are assessed and analyzed.
What the Template Contains
- Historical Data: Contains Foxconn Industrial Internet’s past financial performance and baseline forecasts.
- DCF and Levered DCF Models: Comprehensive templates for calculating the intrinsic value of Foxconn Industrial Internet (601138SS).
- WACC Sheet: Pre-built calculations for the Weighted Average Cost of Capital.
- Editable Inputs: Adjust key drivers such as growth rates, EBITDA percentages, and CAPEX assumptions.
- Quarterly and Annual Statements: A thorough analysis of Foxconn Industrial Internet's financials.
- Interactive Dashboard: Visualize valuation results and projections in a dynamic manner.
Disclaimer
All information, articles, and product details provided on this website are for general informational and educational purposes only. We do not claim any ownership over, nor do we intend to infringe upon, any trademarks, copyrights, logos, brand names, or other intellectual property mentioned or depicted on this site. Such intellectual property remains the property of its respective owners, and any references here are made solely for identification or informational purposes, without implying any affiliation, endorsement, or partnership.
We make no representations or warranties, express or implied, regarding the accuracy, completeness, or suitability of any content or products presented. Nothing on this website should be construed as legal, tax, investment, financial, medical, or other professional advice. In addition, no part of this site—including articles or product references—constitutes a solicitation, recommendation, endorsement, advertisement, or offer to buy or sell any securities, franchises, or other financial instruments, particularly in jurisdictions where such activity would be unlawful.
All content is of a general nature and may not address the specific circumstances of any individual or entity. It is not a substitute for professional advice or services. Any actions you take based on the information provided here are strictly at your own risk. You accept full responsibility for any decisions or outcomes arising from your use of this website and agree to release us from any liability in connection with your use of, or reliance upon, the content or products found herein.