
|
Jiangsu Linyang Energy Co., Ltd. (601222.SS) Évaluation DCF |
Entièrement Modifiable: Adapté À Vos Besoins Dans Excel Ou Sheets
Conception Professionnelle: Modèles Fiables Et Conformes Aux Normes Du Secteur
Pré-Construits Pour Une Utilisation Rapide Et Efficace
Compatible MAC/PC, entièrement débloqué
Aucune Expertise N'Est Requise; Facile À Suivre
Jiangsu Linyang Energy Co., Ltd. (601222.SS) Bundle
Simplifiez Jiangsu Linyang Energy Co., Ltd. (601222SS) Valation avec cette calculatrice DCF personnalisable! Doté de la véritable Jiangsu Linyang Energy Co., Ltd. (601222SS) Financials and Adjustable Prévisions, vous pouvez tester des scénarios et découvrir Jiangsu Linyang Energy Co., Ltd. (601222SS) juste une valeur juste en minutes.
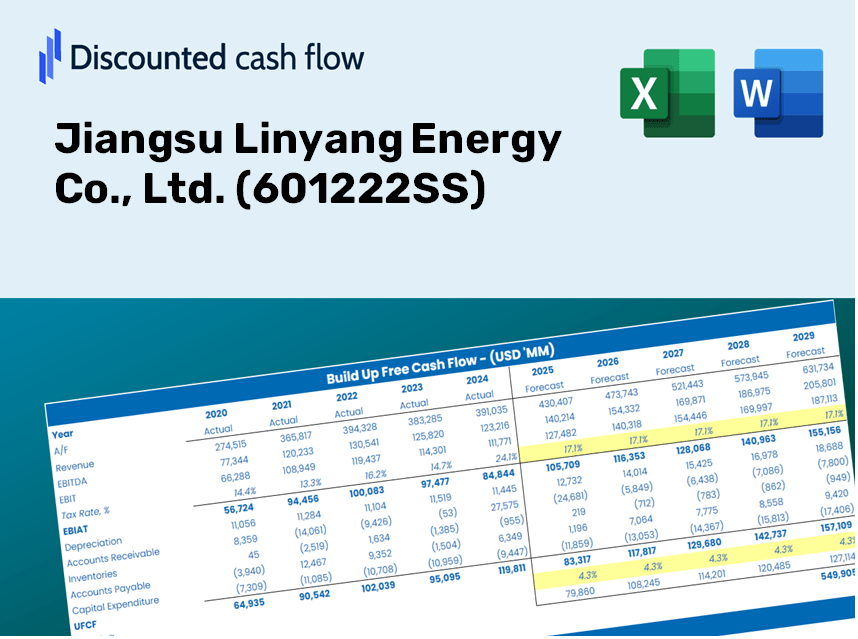
Discounted Cash Flow (DCF) - (USD MM)
| Year | AY1 2020 |
AY2 2021 |
AY3 2022 |
AY4 2023 |
AY5 2024 |
FY1 2025 |
FY2 2026 |
FY3 2027 |
FY4 2028 |
FY5 2029 |
|---|---|---|---|---|---|---|---|---|---|---|
| Revenue | 5,799.0 | 5,296.6 | 4,943.9 | 6,872.1 | 6,742.4 | 7,109.7 | 7,497.0 | 7,905.4 | 8,336.1 | 8,790.2 |
| Revenue Growth, % | 0 | -8.66 | -6.66 | 39 | -1.89 | 5.45 | 5.45 | 5.45 | 5.45 | 5.45 |
| EBITDA | 1,863.8 | 1,826.0 | 1,524.7 | 1,472.1 | 1,525.4 | 2,012.1 | 2,121.7 | 2,237.2 | 2,359.1 | 2,487.6 |
| EBITDA, % | 32.14 | 34.47 | 30.84 | 21.42 | 22.62 | 28.3 | 28.3 | 28.3 | 28.3 | 28.3 |
| Depreciation | 434.9 | 445.5 | 419.7 | 415.4 | 528.4 | 544.3 | 574.0 | 605.3 | 638.2 | 673.0 |
| Depreciation, % | 7.5 | 8.41 | 8.49 | 6.04 | 7.84 | 7.66 | 7.66 | 7.66 | 7.66 | 7.66 |
| EBIT | 1,428.9 | 1,380.5 | 1,105.0 | 1,056.7 | 997.0 | 1,467.7 | 1,547.7 | 1,632.0 | 1,720.9 | 1,814.6 |
| EBIT, % | 24.64 | 26.06 | 22.35 | 15.38 | 14.79 | 20.64 | 20.64 | 20.64 | 20.64 | 20.64 |
| Total Cash | 4,717.1 | 4,414.1 | 6,384.8 | 6,479.8 | 6,317.6 | 6,436.7 | 6,787.4 | 7,157.2 | 7,547.1 | 7,958.2 |
| Total Cash, percent | .0 | .0 | .0 | .0 | .0 | .0 | .0 | .0 | .0 | .0 |
| Account Receivables | 3,948.6 | 5,095.8 | 3,675.2 | 5,411.4 | 4,772.8 | 5,519.6 | 5,820.3 | 6,137.3 | 6,471.7 | 6,824.2 |
| Account Receivables, % | 68.09 | 96.21 | 74.34 | 78.75 | 70.79 | 77.63 | 77.63 | 77.63 | 77.63 | 77.63 |
| Inventories | 760.8 | 588.9 | 1,508.4 | 1,333.2 | 2,776.1 | 1,639.8 | 1,729.2 | 1,823.4 | 1,922.7 | 2,027.4 |
| Inventories, % | 13.12 | 11.12 | 30.51 | 19.4 | 41.17 | 23.06 | 23.06 | 23.06 | 23.06 | 23.06 |
| Accounts Payable | 1,834.5 | 1,517.0 | 2,283.8 | 2,882.4 | 3,981.7 | 2,950.0 | 3,110.8 | 3,280.2 | 3,458.9 | 3,647.3 |
| Accounts Payable, % | 31.63 | 28.64 | 46.19 | 41.94 | 59.05 | 41.49 | 41.49 | 41.49 | 41.49 | 41.49 |
| Capital Expenditure | -176.4 | -406.0 | -738.7 | -1,895.3 | -862.6 | -938.8 | -989.9 | -1,043.9 | -1,100.7 | -1,160.7 |
| Capital Expenditure, % | -3.04 | -7.67 | -14.94 | -27.58 | -12.79 | -13.2 | -13.2 | -13.2 | -13.2 | -13.2 |
| Tax Rate, % | 18.46 | 18.46 | 18.46 | 18.46 | 18.46 | 18.46 | 18.46 | 18.46 | 18.46 | 18.46 |
| EBITAT | 1,248.5 | 1,151.8 | 847.5 | 849.9 | 812.9 | 1,202.0 | 1,267.5 | 1,336.5 | 1,409.3 | 1,486.1 |
| Depreciation | ||||||||||
| Changes in Account Receivables | ||||||||||
| Changes in Inventories | ||||||||||
| Changes in Accounts Payable | ||||||||||
| Capital Expenditure | ||||||||||
| UFCF | -1,367.9 | -101.6 | 1,796.5 | -1,592.5 | 773.8 | 165.4 | 622.2 | 656.1 | 691.9 | 729.6 |
| WACC, % | 7.47 | 7.44 | 7.39 | 7.42 | 7.42 | 7.43 | 7.43 | 7.43 | 7.43 | 7.43 |
| PV UFCF | ||||||||||
| SUM PV UFCF | 2,251.8 | |||||||||
| Long Term Growth Rate, % | 3.50 | |||||||||
| Free cash flow (T + 1) | 755 | |||||||||
| Terminal Value | 19,230 | |||||||||
| Present Terminal Value | 13,441 | |||||||||
| Enterprise Value | 15,693 | |||||||||
| Net Debt | -1,827 | |||||||||
| Equity Value | 17,520 | |||||||||
| Diluted Shares Outstanding, MM | 2,035 | |||||||||
| Equity Value Per Share | 8.61 |
What You Will Receive
- Accurate Linyang Financials: Features historical and projected data for precise valuation.
- Customizable Inputs: Adjust parameters such as WACC, tax rates, revenue growth, and capital investments.
- Automated Calculations: Intrinsic value and NPV calculated in real-time.
- Scenario Analysis: Explore various scenarios to assess the future performance of Jiangsu Linyang Energy Co., Ltd. (601222SS).
- User-Friendly Design: Designed for professionals, yet easy to navigate for newcomers.
Key Features
- Accurate Financial Data for Jiangsu Linyang Energy: Gain access to reliable pre-loaded historical figures and forward-looking estimates.
- Flexible Forecast Variables: Modify highlighted fields such as WACC, growth rates, and profit margins with ease.
- Real-Time Calculations: Enjoy automatic updates for DCF, Net Present Value (NPV), and cash flow assessments.
- Interactive Visual Dashboard: Utilize clear charts and summaries to effectively visualize your valuation findings.
- Designed for All Experience Levels: A user-friendly layout tailored for investors, CFOs, and consultants alike.
How It Operates
- Step 1: Download the Excel file.
- Step 2: Examine the pre-filled financial data and forecasts for Jiangsu Linyang Energy Co., Ltd. (601222SS).
- Step 3: Adjust key variables such as revenue growth, WACC, and tax rates (highlighted cells).
- Step 4: Observe the DCF model update in real-time as you modify your inputs.
- Step 5: Evaluate the results to inform your investment decisions.
Why Opt for Jiangsu Linyang Energy Co., Ltd. (601222SS) Solutions?
- Time-Efficient: Skip the hassle of building models from the ground up – our tools are ready for immediate use.
- Enhanced Precision: Dependable financial data and formulas minimize errors in your assessments.
- Completely Adjustable: Customize the model to align with your unique assumptions and forecasts.
- User-Friendly Insights: Intuitive charts and outputs facilitate easy result analysis.
- Endorsed by Professionals: Created for experts who prioritize accuracy and functionality.
Who Can Benefit from Jiangsu Linyang Energy Co., Ltd. (601222SS)?
- Energy Sector Students: Explore energy market analysis and apply practical valuation techniques using real-world data.
- Researchers: Integrate industry-specific models into academic projects or publications.
- Investors: Validate your strategies and evaluate valuation metrics for Jiangsu Linyang Energy Co., Ltd. (601222SS).
- Financial Analysts: Optimize your analysis process with a customizable financial model tailored for energy companies.
- Entrepreneurs: Understand the evaluation methods used in assessing large energy firms like Jiangsu Linyang Energy Co., Ltd. (601222SS).
Contents of the Template
- Pre-Filled Data: Contains Jiangsu Linyang Energy Co., Ltd.'s historical financials and projections.
- Discounted Cash Flow Model: Editable DCF valuation model featuring automatic calculations.
- Weighted Average Cost of Capital (WACC): A dedicated worksheet for calculating WACC with customizable inputs.
- Key Financial Ratios: Evaluate Jiangsu Linyang Energy's profitability, efficiency, and leverage metrics.
- Customizable Inputs: Easily modify revenue growth, profit margins, and tax rates.
- Clear Dashboard: Visual representations and tables summarizing the key valuation outcomes.
Disclaimer
All information, articles, and product details provided on this website are for general informational and educational purposes only. We do not claim any ownership over, nor do we intend to infringe upon, any trademarks, copyrights, logos, brand names, or other intellectual property mentioned or depicted on this site. Such intellectual property remains the property of its respective owners, and any references here are made solely for identification or informational purposes, without implying any affiliation, endorsement, or partnership.
We make no representations or warranties, express or implied, regarding the accuracy, completeness, or suitability of any content or products presented. Nothing on this website should be construed as legal, tax, investment, financial, medical, or other professional advice. In addition, no part of this site—including articles or product references—constitutes a solicitation, recommendation, endorsement, advertisement, or offer to buy or sell any securities, franchises, or other financial instruments, particularly in jurisdictions where such activity would be unlawful.
All content is of a general nature and may not address the specific circumstances of any individual or entity. It is not a substitute for professional advice or services. Any actions you take based on the information provided here are strictly at your own risk. You accept full responsibility for any decisions or outcomes arising from your use of this website and agree to release us from any liability in connection with your use of, or reliance upon, the content or products found herein.