
|
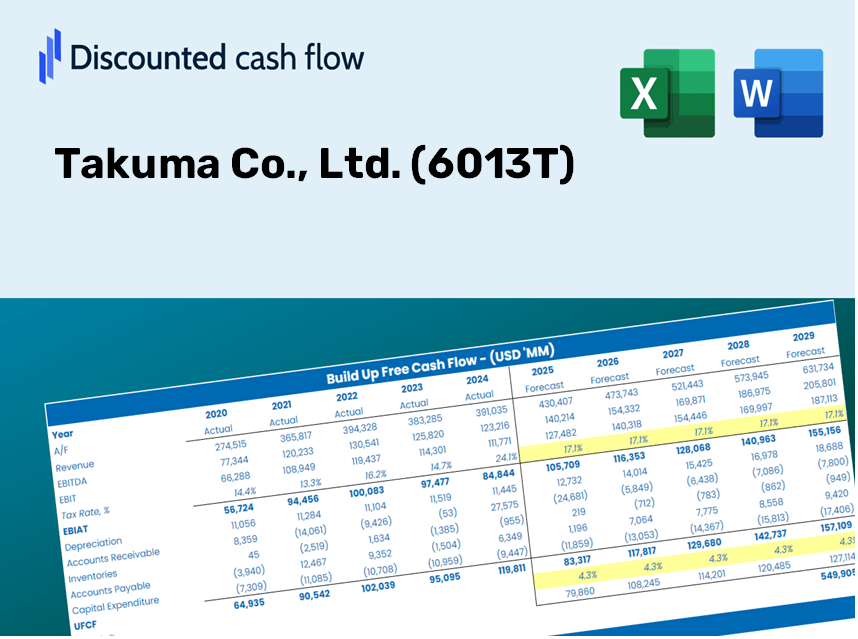
Takuma Co., Ltd. (6013.T) Évaluation DCF |
Entièrement Modifiable: Adapté À Vos Besoins Dans Excel Ou Sheets
Conception Professionnelle: Modèles Fiables Et Conformes Aux Normes Du Secteur
Pré-Construits Pour Une Utilisation Rapide Et Efficace
Compatible MAC/PC, entièrement débloqué
Aucune Expertise N'Est Requise; Facile À Suivre
Takuma Co., Ltd. (6013.T) Bundle
Améliorez vos stratégies d'investissement avec la calculatrice (6013T) DCF! Explorez Takuma Co., Ltd. Financials, ajustez les prédictions et dépenses de croissance et observez instantanément comment ces modifications affectent la valeur intrinsèque de (6013T).
Discounted Cash Flow (DCF) - (USD MM)
| Year | AY1 2021 |
AY2 2022 |
AY3 2023 |
AY4 2024 |
AY5 2025 |
FY1 2026 |
FY2 2027 |
FY3 2028 |
FY4 2029 |
FY5 2030 |
|---|---|---|---|---|---|---|---|---|---|---|
| Revenue | 146,726.0 | 134,092.0 | 142,651.0 | 149,166.0 | 151,161.0 | 152,550.5 | 153,952.8 | 155,367.9 | 156,796.1 | 158,237.4 |
| Revenue Growth, % | 0 | -8.61 | 6.38 | 4.57 | 1.34 | 0.91921 | 0.91921 | 0.91921 | 0.91921 | 0.91921 |
| EBITDA | 11,750.0 | 11,755.0 | 15,240.0 | 14,231.0 | 16,878.0 | 14,694.8 | 14,829.9 | 14,966.2 | 15,103.8 | 15,242.6 |
| EBITDA, % | 8.01 | 8.77 | 10.68 | 9.54 | 11.17 | 9.63 | 9.63 | 9.63 | 9.63 | 9.63 |
| Depreciation | 1,036.0 | 961.0 | 1,136.0 | 1,797.0 | 1,934.0 | 1,435.0 | 1,448.1 | 1,461.5 | 1,474.9 | 1,488.5 |
| Depreciation, % | 0.70608 | 0.71667 | 0.79635 | 1.2 | 1.28 | 0.94065 | 0.94065 | 0.94065 | 0.94065 | 0.94065 |
| EBIT | 10,714.0 | 10,794.0 | 14,104.0 | 12,434.0 | 14,944.0 | 13,259.9 | 13,381.8 | 13,504.8 | 13,628.9 | 13,754.2 |
| EBIT, % | 7.3 | 8.05 | 9.89 | 8.34 | 9.89 | 8.69 | 8.69 | 8.69 | 8.69 | 8.69 |
| Total Cash | 44,422.0 | 42,979.0 | 65,242.0 | 45,337.0 | 39,431.0 | 50,201.9 | 50,663.3 | 51,129.0 | 51,599.0 | 52,073.3 |
| Total Cash, percent | .0 | .0 | .0 | .0 | .0 | .0 | .0 | .0 | .0 | .0 |
| Account Receivables | 84,206.0 | 82,100.0 | 60,850.0 | 78,963.0 | 82,276.0 | 81,962.0 | 82,715.4 | 83,475.7 | 84,243.0 | 85,017.4 |
| Account Receivables, % | 57.39 | 61.23 | 42.66 | 52.94 | 54.43 | 53.73 | 53.73 | 53.73 | 53.73 | 53.73 |
| Inventories | 4,463.0 | 4,603.0 | 6,010.0 | 9,739.0 | 11,933.0 | 7,661.3 | 7,731.7 | 7,802.8 | 7,874.5 | 7,946.9 |
| Inventories, % | 3.04 | 3.43 | 4.21 | 6.53 | 7.89 | 5.02 | 5.02 | 5.02 | 5.02 | 5.02 |
| Accounts Payable | 30,717.0 | 33,070.0 | 26,610.0 | 43,413.0 | 33,439.0 | 35,231.9 | 35,555.8 | 35,882.6 | 36,212.5 | 36,545.3 |
| Accounts Payable, % | 20.93 | 24.66 | 18.65 | 29.1 | 22.12 | 23.1 | 23.1 | 23.1 | 23.1 | 23.1 |
| Capital Expenditure | -2,354.0 | -1,571.0 | -5,909.0 | -5,509.0 | -2,307.0 | -3,703.2 | -3,737.2 | -3,771.6 | -3,806.3 | -3,841.2 |
| Capital Expenditure, % | -1.6 | -1.17 | -4.14 | -3.69 | -1.53 | -2.43 | -2.43 | -2.43 | -2.43 | -2.43 |
| Tax Rate, % | 30.4 | 30.4 | 30.4 | 30.4 | 30.4 | 30.4 | 30.4 | 30.4 | 30.4 | 30.4 |
| EBITAT | 7,538.9 | 7,437.4 | 9,622.4 | 8,758.9 | 10,400.4 | 9,216.4 | 9,301.2 | 9,386.7 | 9,472.9 | 9,560.0 |
| Depreciation | ||||||||||
| Changes in Account Receivables | ||||||||||
| Changes in Inventories | ||||||||||
| Changes in Accounts Payable | ||||||||||
| Capital Expenditure | ||||||||||
| UFCF | -51,731.1 | 11,146.4 | 18,232.4 | 7.9 | -5,453.6 | 13,326.9 | 6,512.1 | 6,572.0 | 6,632.4 | 6,693.3 |
| WACC, % | 7.14 | 7.14 | 7.14 | 7.14 | 7.14 | 7.14 | 7.14 | 7.14 | 7.14 | 7.14 |
| PV UFCF | ||||||||||
| SUM PV UFCF | 33,228.9 | |||||||||
| Long Term Growth Rate, % | 1.00 | |||||||||
| Free cash flow (T + 1) | 6,760 | |||||||||
| Terminal Value | 110,074 | |||||||||
| Present Terminal Value | 77,964 | |||||||||
| Enterprise Value | 111,193 | |||||||||
| Net Debt | -27,345 | |||||||||
| Equity Value | 138,538 | |||||||||
| Diluted Shares Outstanding, MM | 79 | |||||||||
| Equity Value Per Share | 1,762.95 |
What You'll Receive
- Pre-Filled Financial Model: Access to Takuma Co., Ltd. (6013T) actual data for accurate DCF valuation.
- Comprehensive Forecast Control: Modify key factors such as revenue growth, profit margins, WACC, and more.
- Real-Time Calculations: Instant updates allow you to view results immediately as you make adjustments.
- Professional-Grade Template: A polished Excel file crafted for high-quality valuation presentations.
- Flexible and Reusable: Designed for adaptability, enabling repeated use for in-depth financial forecasts.
Key Features
- Real-Time Takuma Data: Pre-filled with Takuma Co., Ltd.'s historical financials and future projections.
- Fully Customizable Inputs: Modify revenue growth, profit margins, WACC, tax rates, and capital expenditures.
- Dynamic Valuation Model: Automatically updates Net Present Value (NPV) and intrinsic value based on your adjustments.
- Scenario Analysis: Generate multiple forecasting scenarios to explore various valuation outcomes.
- User-Friendly Interface: Intuitive design that caters to both experienced professionals and newcomers.
How It Works
- Step 1: Download the Excel spreadsheet.
- Step 2: Examine the pre-filled Takuma Co., Ltd. (6013T) data (both historical and forecasted).
- Step 3: Modify key assumptions (highlighted in yellow) according to your analysis.
- Step 4: Observe the automatic recalculations for the intrinsic value of Takuma Co., Ltd. (6013T).
- Step 5: Utilize the results for your investment decisions or reports.
Why Opt for the Takuma Co., Ltd. Calculator?
- Designed for Experts: A sophisticated tool utilized by financial analysts, CFOs, and consultants.
- Accurate Financials: Takuma Co., Ltd.'s historical and projected financial data preloaded for precise insights.
- Flexible Scenario Analysis: Effortlessly test various forecasts and assumptions.
- Concise Results: Instantly computes intrinsic value, NPV, and essential performance metrics.
- User-Friendly: Step-by-step guidance ensures a smooth process.
Who Can Benefit from Takuma Co., Ltd. (6013T)?
- Finance Students: Discover valuation methods and apply them to real market data.
- Researchers: Integrate advanced financial models into your academic projects or studies.
- Investors: Validate your investment hypotheses and assess valuation scenarios for Takuma Co., Ltd. (6013T).
- Financial Analysts: Enhance your analysis process with a ready-to-use, adaptable DCF model.
- Small Business Owners: Learn how major public companies like Takuma Co., Ltd. (6013T) are evaluated in the market.
Contents of the Template
- Pre-Filled Data: Includes Takuma Co., Ltd.'s historical financials and projections.
- Discounted Cash Flow Model: An editable DCF valuation model featuring automated calculations.
- Weighted Average Cost of Capital (WACC): A specific sheet for calculating WACC using your own inputs.
- Key Financial Ratios: Evaluate Takuma Co., Ltd.'s profitability, efficiency, and leverage.
- Customizable Inputs: Easily modify revenue growth, margins, and tax rates.
- Clear Dashboard: Visualizations and tables that summarize essential valuation outcomes.
Disclaimer
All information, articles, and product details provided on this website are for general informational and educational purposes only. We do not claim any ownership over, nor do we intend to infringe upon, any trademarks, copyrights, logos, brand names, or other intellectual property mentioned or depicted on this site. Such intellectual property remains the property of its respective owners, and any references here are made solely for identification or informational purposes, without implying any affiliation, endorsement, or partnership.
We make no representations or warranties, express or implied, regarding the accuracy, completeness, or suitability of any content or products presented. Nothing on this website should be construed as legal, tax, investment, financial, medical, or other professional advice. In addition, no part of this site—including articles or product references—constitutes a solicitation, recommendation, endorsement, advertisement, or offer to buy or sell any securities, franchises, or other financial instruments, particularly in jurisdictions where such activity would be unlawful.
All content is of a general nature and may not address the specific circumstances of any individual or entity. It is not a substitute for professional advice or services. Any actions you take based on the information provided here are strictly at your own risk. You accept full responsibility for any decisions or outcomes arising from your use of this website and agree to release us from any liability in connection with your use of, or reliance upon, the content or products found herein.