
|
Jilin Expressway Co., Ltd. (601518.SS) Évaluation DCF |
Entièrement Modifiable: Adapté À Vos Besoins Dans Excel Ou Sheets
Conception Professionnelle: Modèles Fiables Et Conformes Aux Normes Du Secteur
Pré-Construits Pour Une Utilisation Rapide Et Efficace
Compatible MAC/PC, entièrement débloqué
Aucune Expertise N'Est Requise; Facile À Suivre
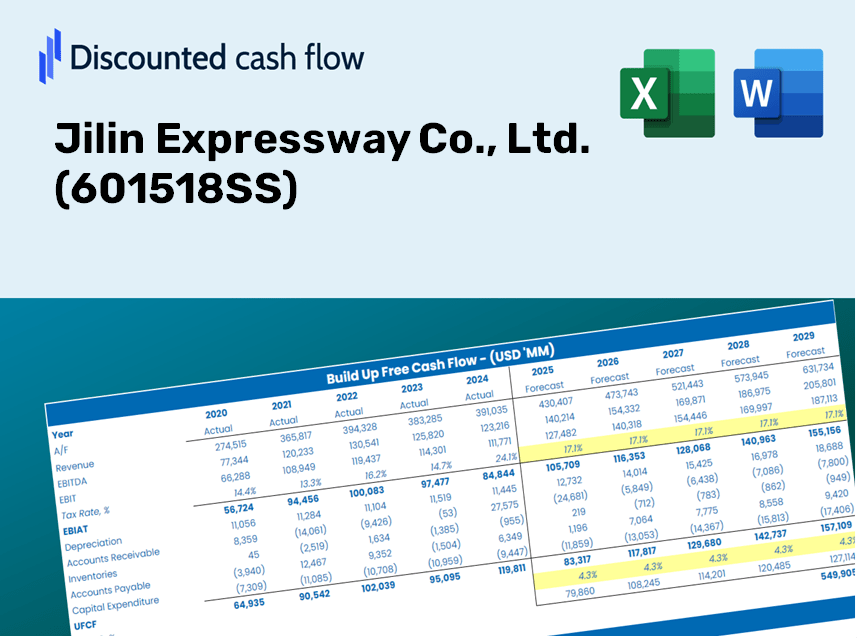
Jilin Expressway Co., Ltd. (601518.SS) Bundle
Améliorez votre stratégie d'investissement avec la calculatrice DCF (601518SS)! Utilisez Authentic Jilin Expressway Co., Ltd. Données financières, ajustez les prévisions et dépenses de croissance et visualisez instantanément comment ces altérations affectent la valeur intrinsèque de (601518SS).
Discounted Cash Flow (DCF) - (USD MM)
| Year | AY1 2020 |
AY2 2021 |
AY3 2022 |
AY4 2023 |
AY5 2024 |
FY1 2025 |
FY2 2026 |
FY3 2027 |
FY4 2028 |
FY5 2029 |
|---|---|---|---|---|---|---|---|---|---|---|
| Revenue | 850.4 | 1,272.0 | 1,459.1 | 1,447.1 | 1,484.4 | 1,436.8 | 1,390.6 | 1,346.0 | 1,302.8 | 1,261.0 |
| Revenue Growth, % | 0 | 49.58 | 14.71 | -0.82375 | 2.58 | -3.21 | -3.21 | -3.21 | -3.21 | -3.21 |
| EBITDA | 463.5 | 826.6 | 903.8 | 1,125.9 | 993.2 | 937.2 | 907.1 | 878.0 | 849.8 | 822.5 |
| EBITDA, % | 54.51 | 64.98 | 61.94 | 77.81 | 66.91 | 65.23 | 65.23 | 65.23 | 65.23 | 65.23 |
| Depreciation | 249.6 | 310.8 | 317.6 | 325.7 | 248.1 | 329.8 | 319.2 | 309.0 | 299.1 | 289.5 |
| Depreciation, % | 29.36 | 24.44 | 21.77 | 22.51 | 16.71 | 22.96 | 22.96 | 22.96 | 22.96 | 22.96 |
| EBIT | 213.9 | 515.7 | 586.2 | 800.2 | 745.1 | 607.4 | 587.9 | 569.0 | 550.7 | 533.0 |
| EBIT, % | 25.15 | 40.54 | 40.18 | 55.3 | 50.19 | 42.27 | 42.27 | 42.27 | 42.27 | 42.27 |
| Total Cash | 870.3 | 1,155.0 | 933.0 | 1,512.5 | 1,670.4 | 1,306.7 | 1,264.8 | 1,224.2 | 1,184.9 | 1,146.8 |
| Total Cash, percent | .0 | .0 | .0 | .0 | .0 | .0 | .0 | .0 | .0 | .0 |
| Account Receivables | 170.5 | 127.8 | 189.7 | 161.7 | 112.0 | 177.6 | 171.9 | 166.4 | 161.0 | 155.9 |
| Account Receivables, % | 20.05 | 10.04 | 13 | 11.17 | 7.54 | 12.36 | 12.36 | 12.36 | 12.36 | 12.36 |
| Inventories | 198.8 | 222.0 | 64.8 | 322.6 | 145.7 | 222.3 | 215.2 | 208.3 | 201.6 | 195.1 |
| Inventories, % | 23.37 | 17.45 | 4.44 | 22.29 | 9.81 | 15.47 | 15.47 | 15.47 | 15.47 | 15.47 |
| Accounts Payable | 195.8 | 160.1 | 144.5 | 154.8 | 150.9 | 190.7 | 184.6 | 178.7 | 172.9 | 167.4 |
| Accounts Payable, % | 23.02 | 12.58 | 9.9 | 10.7 | 10.16 | 13.27 | 13.27 | 13.27 | 13.27 | 13.27 |
| Capital Expenditure | -115.7 | -56.5 | -19.4 | -15.1 | -18.2 | -62.2 | -60.2 | -58.3 | -56.4 | -54.6 |
| Capital Expenditure, % | -13.6 | -4.45 | -1.33 | -1.05 | -1.23 | -4.33 | -4.33 | -4.33 | -4.33 | -4.33 |
| Tax Rate, % | 26.76 | 26.76 | 26.76 | 26.76 | 26.76 | 26.76 | 26.76 | 26.76 | 26.76 | 26.76 |
| EBITAT | 186.2 | 378.4 | 423.6 | 562.9 | 545.8 | 457.1 | 442.4 | 428.2 | 414.5 | 401.1 |
| Depreciation | ||||||||||
| Changes in Account Receivables | ||||||||||
| Changes in Inventories | ||||||||||
| Changes in Accounts Payable | ||||||||||
| Capital Expenditure | ||||||||||
| UFCF | 146.7 | 616.4 | 801.4 | 654.1 | 998.3 | 622.3 | 708.1 | 685.4 | 663.4 | 642.1 |
| WACC, % | 5.03 | 5 | 5 | 4.99 | 5 | 5.01 | 5.01 | 5.01 | 5.01 | 5.01 |
| PV UFCF | ||||||||||
| SUM PV UFCF | 2,875.5 | |||||||||
| Long Term Growth Rate, % | 0.50 | |||||||||
| Free cash flow (T + 1) | 645 | |||||||||
| Terminal Value | 14,322 | |||||||||
| Present Terminal Value | 11,219 | |||||||||
| Enterprise Value | 14,094 | |||||||||
| Net Debt | -1,655 | |||||||||
| Equity Value | 15,750 | |||||||||
| Diluted Shares Outstanding, MM | 1,891 | |||||||||
| Equity Value Per Share | 8.33 |
What You Will Receive
- Authentic Jilin Expressway Data: Comprehensive financials – covering everything from revenue to EBIT – based on real and projected metrics.
- Complete Customization: Modify all essential variables (yellow cells) such as WACC, growth %, and tax rates.
- Instant Valuation Adjustments: Automatic recalculations to assess the effect of changes on the fair value of Jilin Expressway Co., Ltd. (601518SS).
- Flexible Excel Template: Designed for quick modifications, scenario analysis, and in-depth projections.
- Efficient and Precise: Eliminate the need to construct models from the ground up while ensuring accuracy and adaptability.
Key Features
- Comprehensive Jilin Expressway Data: Pre-filled with Jilin Expressway's historical financial performance and future projections.
- Fully Customizable Inputs: Modify revenue growth rates, profit margins, discount rates, tax percentages, and capital expenditures.
- Dynamic Valuation Model: Automatic recalculations of Net Present Value (NPV) and intrinsic value based on user-defined parameters.
- Scenario Analysis: Develop various forecasting scenarios to explore different valuation results.
- User-Friendly Interface: Intuitive and organized design suitable for both professionals and novices.
How It Functions
- Step 1: Download the preconfigured Excel template featuring Jilin Expressway Co., Ltd. (601518SS) data.
- Step 2: Navigate through the pre-filled sheets and familiarize yourself with the essential metrics.
- Step 3: Modify forecasts and assumptions in the editable yellow cells (WACC, growth rates, margins).
- Step 4: Immediately view updated results, including the intrinsic value of Jilin Expressway Co., Ltd. (601518SS).
- Step 5: Make well-informed investment choices or generate reports based on the results provided.
Why Choose This Calculator for Jilin Expressway Co., Ltd. (601518SS)?
- Reliable Data: Authentic financial information for Jilin Expressway Co., Ltd. ensures dependable valuation outcomes.
- Tailorable: Modify essential factors such as growth rates, WACC, and tax rates to align with your forecasts.
- Efficiency: Pre-configured calculations save you the time of starting from the ground up.
- Expert-Level Tool: Crafted for investors, analysts, and consultants in the infrastructure sector.
- User-Friendly: Designed with an intuitive interface and easy-to-follow instructions for all users.
Who Should Utilize Jilin Expressway Co., Ltd. (601518SS)?
- Finance Students: Discover highway valuation methods and practice using real market data.
- Academics: Integrate advanced financial models into your studies or research projects.
- Investors: Evaluate your investment strategies and assess the valuation metrics for Jilin Expressway (601518SS).
- Analysts: Enhance your analytical process with a customizable financial model tailored for Jilin Expressway (601518SS).
- Small Business Owners: Understand how major public infrastructure companies like Jilin Expressway (601518SS) are appraised.
Contents of the Template
- Preloaded Jilin Expressway Data: Historical and forecasted financial information, encompassing revenue, EBIT, and capital expenditures.
- DCF and WACC Models: Professional-grade spreadsheets designed for calculating intrinsic value and Weighted Average Cost of Capital.
- Editable Inputs: Yellow-highlighted cells available for modifying revenue growth, tax rates, and discount rates.
- Financial Statements: Detailed annual and quarterly financial reports for in-depth analysis.
- Key Ratios: Ratios related to profitability, leverage, and efficiency for performance evaluation.
- Dashboard and Charts: Visual representations of valuation results and underlying assumptions.
Disclaimer
All information, articles, and product details provided on this website are for general informational and educational purposes only. We do not claim any ownership over, nor do we intend to infringe upon, any trademarks, copyrights, logos, brand names, or other intellectual property mentioned or depicted on this site. Such intellectual property remains the property of its respective owners, and any references here are made solely for identification or informational purposes, without implying any affiliation, endorsement, or partnership.
We make no representations or warranties, express or implied, regarding the accuracy, completeness, or suitability of any content or products presented. Nothing on this website should be construed as legal, tax, investment, financial, medical, or other professional advice. In addition, no part of this site—including articles or product references—constitutes a solicitation, recommendation, endorsement, advertisement, or offer to buy or sell any securities, franchises, or other financial instruments, particularly in jurisdictions where such activity would be unlawful.
All content is of a general nature and may not address the specific circumstances of any individual or entity. It is not a substitute for professional advice or services. Any actions you take based on the information provided here are strictly at your own risk. You accept full responsibility for any decisions or outcomes arising from your use of this website and agree to release us from any liability in connection with your use of, or reliance upon, the content or products found herein.