
|
Anhui Great Wall Military Industry Co., Ltd. (601606.SS) Évaluation DCF |
Entièrement Modifiable: Adapté À Vos Besoins Dans Excel Ou Sheets
Conception Professionnelle: Modèles Fiables Et Conformes Aux Normes Du Secteur
Pré-Construits Pour Une Utilisation Rapide Et Efficace
Compatible MAC/PC, entièrement débloqué
Aucune Expertise N'Est Requise; Facile À Suivre
Anhui Great Wall Military Industry Co., Ltd. (601606.SS) Bundle
Explorez le potentiel financier d'Anhui Great Wall Military Industry Co., Ltd. (601606SS) avec notre calculatrice DCF conviviale! Entrez vos projections pour la croissance, les marges bénéficiaires et les dépenses pour déterminer la valeur intrinsèque d'Anhui Great Wall Military Industry Co., Ltd. (601606SS) et affinez votre approche d'investissement.
What You Will Receive
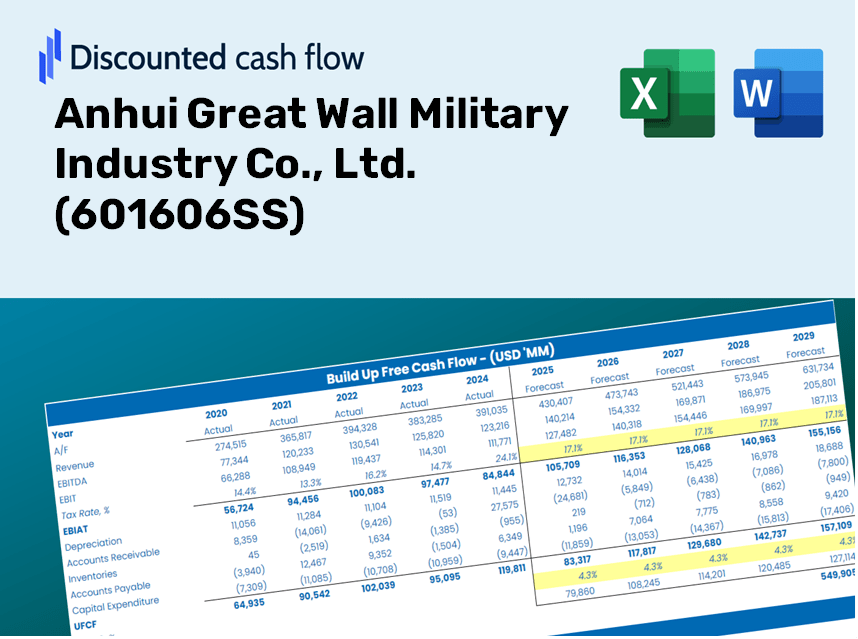
- Accurate Great Wall Data: Comprehensive financials – covering everything from revenue to EBIT – derived from actual and projected data.
- Complete Customization: Modify all essential parameters (yellow cells) including WACC, growth %, and tax rates.
- Immediate Valuation Updates: Automatic recalculations to assess the effect of changes on the fair value of Anhui Great Wall Military Industry Co., Ltd. (601606SS).
- Flexible Excel Template: Designed for easy modifications, scenario analysis, and in-depth forecasting.
- Efficient and Precise: Eliminate the need to build models from the ground up while ensuring accuracy and adaptability.
Key Features
- 🔍 Real-Life (601606SS) Financials: Pre-filled historical and projected data for Anhui Great Wall Military Industry Co., Ltd.
- ✏️ Fully Customizable Inputs: Adjust all critical parameters (yellow cells) like WACC, growth %, and tax rates.
- 📊 Professional DCF Valuation: Built-in formulas calculate the intrinsic value of Anhui Great Wall Military Industry Co., Ltd. using the Discounted Cash Flow method.
- ⚡ Instant Results: Visualize the valuation of Anhui Great Wall Military Industry Co., Ltd. instantly after making changes.
- Scenario Analysis: Test and compare outcomes for various financial assumptions side-by-side.
How It Works
- Step 1: Download the Excel file.
- Step 2: Review the pre-filled data for Anhui Great Wall Military Industry Co., Ltd. (601606SS), including historical and projected figures.
- Step 3: Modify key assumptions (highlighted in yellow) based on your analysis.
- Step 4: Observe the automatic recalculations for the intrinsic value of Anhui Great Wall Military Industry Co., Ltd. (601606SS).
- Step 5: Utilize the results for investment decisions or reporting purposes.
Why Opt for Our Calculator?
- All-in-One Solution: Features DCF, WACC, and financial ratio evaluations tailored for Anhui Great Wall Military Industry Co., Ltd. (601606SS).
- Flexible Inputs: Modify the highlighted cells to explore different financial scenarios.
- In-Depth Analysis: Provides automatic calculations for Anhui Great Wall’s intrinsic value and Net Present Value.
- Integrated Data: Comes with historical and projected data to ensure reliable starting figures.
- High-Caliber Tool: Perfect for financial analysts, investors, and business advisors focused on (601606SS).
Who Can Benefit from Anhui Great Wall Military Industry Co., Ltd. (601606SS)?
- Investors: Make informed investment choices with a robust valuation tool tailored for military industry insights.
- Financial Analysts: Streamline your analysis process with a customizable DCF model designed specifically for defense sector evaluations.
- Consultants: Effortlessly modify the template for client reports or presentations focused on military technology and innovation.
- Finance Enthusiasts: Enhance your grasp of valuation strategies through practical examples from the defense industry.
- Educators and Students: Utilize it as a hands-on resource for finance courses related to the defense and aerospace sectors.
What the Template Contains
- Pre-Filled DCF Model: Anhui Great Wall Military Industry’s financial data preloaded for immediate use.
- WACC Calculator: Comprehensive calculations for Weighted Average Cost of Capital.
- Financial Ratios: Assess Anhui Great Wall’s profitability, leverage, and efficiency.
- Editable Inputs: Adjust assumptions such as growth rates, margins, and CAPEX to suit your scenarios.
- Financial Statements: Annual and quarterly reports to facilitate in-depth analysis.
- Interactive Dashboard: Easily visualize essential valuation metrics and outcomes.
Disclaimer
All information, articles, and product details provided on this website are for general informational and educational purposes only. We do not claim any ownership over, nor do we intend to infringe upon, any trademarks, copyrights, logos, brand names, or other intellectual property mentioned or depicted on this site. Such intellectual property remains the property of its respective owners, and any references here are made solely for identification or informational purposes, without implying any affiliation, endorsement, or partnership.
We make no representations or warranties, express or implied, regarding the accuracy, completeness, or suitability of any content or products presented. Nothing on this website should be construed as legal, tax, investment, financial, medical, or other professional advice. In addition, no part of this site—including articles or product references—constitutes a solicitation, recommendation, endorsement, advertisement, or offer to buy or sell any securities, franchises, or other financial instruments, particularly in jurisdictions where such activity would be unlawful.
All content is of a general nature and may not address the specific circumstances of any individual or entity. It is not a substitute for professional advice or services. Any actions you take based on the information provided here are strictly at your own risk. You accept full responsibility for any decisions or outcomes arising from your use of this website and agree to release us from any liability in connection with your use of, or reliance upon, the content or products found herein.