
|
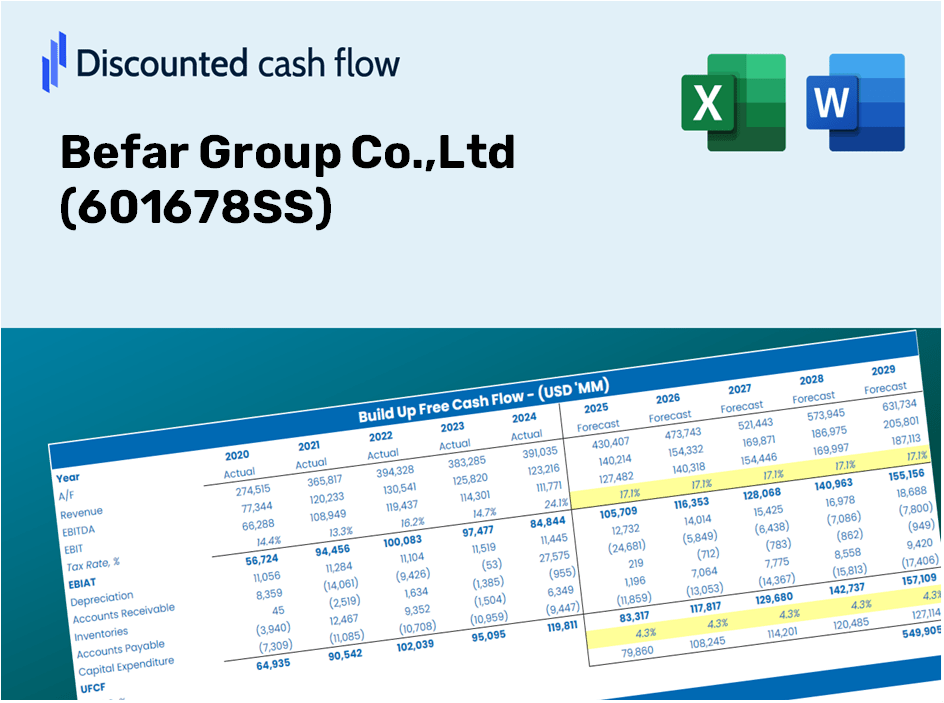
Befar Group Co., Ltd (601678.SS) Évaluation DCF |
Entièrement Modifiable: Adapté À Vos Besoins Dans Excel Ou Sheets
Conception Professionnelle: Modèles Fiables Et Conformes Aux Normes Du Secteur
Pré-Construits Pour Une Utilisation Rapide Et Efficace
Compatible MAC/PC, entièrement débloqué
Aucune Expertise N'Est Requise; Facile À Suivre
Befar Group Co.,Ltd (601678.SS) Bundle
Simplifiez BEFAR GROUP CO., LTD VALUATION AVEC CETTE CALPALUCLE DCF Personnalisable! Doté de Real Befar Group Co., Ltd Financials et des entrées de prévision ajustées, vous pouvez tester des scénarios et découvrir Befar Group Co., Ltd Fair Value en quelques minutes.
Discounted Cash Flow (DCF) - (USD MM)
| Year | AY1 2020 |
AY2 2021 |
AY3 2022 |
AY4 2023 |
AY5 2024 |
FY1 2025 |
FY2 2026 |
FY3 2027 |
FY4 2028 |
FY5 2029 |
|---|---|---|---|---|---|---|---|---|---|---|
| Revenue | 6,457.1 | 9,268.1 | 8,892.1 | 7,305.9 | 10,228.1 | 11,804.1 | 13,622.9 | 15,722.0 | 18,144.6 | 20,940.4 |
| Revenue Growth, % | 0 | 43.53 | -4.06 | -17.84 | 40 | 15.41 | 15.41 | 15.41 | 15.41 | 15.41 |
| EBITDA | 1,396.5 | 2,842.2 | 2,211.1 | 1,159.5 | 1,219.3 | 2,477.7 | 2,859.5 | 3,300.1 | 3,808.6 | 4,395.5 |
| EBITDA, % | 21.63 | 30.67 | 24.87 | 15.87 | 11.92 | 20.99 | 20.99 | 20.99 | 20.99 | 20.99 |
| Depreciation | 510.3 | 483.0 | 501.3 | 556.2 | 837.5 | 815.7 | 941.4 | 1,086.5 | 1,253.9 | 1,447.1 |
| Depreciation, % | 7.9 | 5.21 | 5.64 | 7.61 | 8.19 | 6.91 | 6.91 | 6.91 | 6.91 | 6.91 |
| EBIT | 886.3 | 2,359.2 | 1,709.8 | 603.3 | 381.8 | 1,662.0 | 1,918.1 | 2,213.7 | 2,554.8 | 2,948.4 |
| EBIT, % | 13.73 | 25.46 | 19.23 | 8.26 | 3.73 | 14.08 | 14.08 | 14.08 | 14.08 | 14.08 |
| Total Cash | 3,213.8 | 3,308.1 | 2,777.9 | 2,066.8 | 764.2 | 3,599.5 | 4,154.1 | 4,794.2 | 5,532.9 | 6,385.4 |
| Total Cash, percent | .0 | .0 | .0 | .0 | .0 | .0 | .0 | .0 | .0 | .0 |
| Account Receivables | 1,213.7 | 1,241.7 | 812.0 | 874.7 | 708.4 | 1,421.8 | 1,640.8 | 1,893.7 | 2,185.5 | 2,522.2 |
| Account Receivables, % | 18.8 | 13.4 | 9.13 | 11.97 | 6.93 | 12.04 | 12.04 | 12.04 | 12.04 | 12.04 |
| Inventories | 450.0 | 560.3 | 580.0 | 521.5 | 1,071.8 | 877.1 | 1,012.3 | 1,168.3 | 1,348.3 | 1,556.0 |
| Inventories, % | 6.97 | 6.05 | 6.52 | 7.14 | 10.48 | 7.43 | 7.43 | 7.43 | 7.43 | 7.43 |
| Accounts Payable | 380.5 | 611.8 | 942.0 | 857.7 | 1,129.2 | 1,082.9 | 1,249.7 | 1,442.3 | 1,664.5 | 1,921.0 |
| Accounts Payable, % | 5.89 | 6.6 | 10.59 | 11.74 | 11.04 | 9.17 | 9.17 | 9.17 | 9.17 | 9.17 |
| Capital Expenditure | -1,172.1 | -2,383.3 | -1,170.0 | -2,403.4 | -2,019.4 | -2,589.0 | -2,987.9 | -3,448.3 | -3,979.6 | -4,592.8 |
| Capital Expenditure, % | -18.15 | -25.72 | -13.16 | -32.9 | -19.74 | -21.93 | -21.93 | -21.93 | -21.93 | -21.93 |
| Tax Rate, % | -77.84 | -77.84 | -77.84 | -77.84 | -77.84 | -77.84 | -77.84 | -77.84 | -77.84 | -77.84 |
| EBITAT | 645.0 | 1,741.5 | 1,299.7 | 472.9 | 679.0 | 1,332.9 | 1,538.3 | 1,775.3 | 2,048.9 | 2,364.6 |
| Depreciation | ||||||||||
| Changes in Account Receivables | ||||||||||
| Changes in Inventories | ||||||||||
| Changes in Accounts Payable | ||||||||||
| Capital Expenditure | ||||||||||
| UFCF | -1,300.0 | -65.8 | 1,371.2 | -1,462.8 | -615.4 | -1,005.4 | -695.6 | -802.8 | -926.5 | -1,069.2 |
| WACC, % | 4.87 | 4.89 | 4.93 | 4.98 | 5.38 | 5.01 | 5.01 | 5.01 | 5.01 | 5.01 |
| PV UFCF | ||||||||||
| SUM PV UFCF | -3,880.7 | |||||||||
| Long Term Growth Rate, % | 0.50 | |||||||||
| Free cash flow (T + 1) | -1,075 | |||||||||
| Terminal Value | -23,825 | |||||||||
| Present Terminal Value | -18,658 | |||||||||
| Enterprise Value | -22,539 | |||||||||
| Net Debt | 7,343 | |||||||||
| Equity Value | -29,882 | |||||||||
| Diluted Shares Outstanding, MM | 1,993 | |||||||||
| Equity Value Per Share | -14.99 |
What You Will Receive
- Authentic Befar Financials: Access to both historical and projected data for precise valuation.
- Customizable Inputs: Adjust parameters such as WACC, tax rates, revenue growth, and capital expenditures.
- Real-Time Calculations: Intrinsic value and NPV are computed automatically.
- Scenario Testing: Evaluate various scenarios to assess the future performance of Befar Group (601678SS).
- User-Friendly Design: Designed for professionals but easy enough for newcomers to navigate.
Key Features
- Customizable Financial Inputs: Adjust essential parameters such as revenue growth, EBITDA %, and capital investments.
- Instant DCF Valuation: Automatically computes intrinsic value, NPV, and additional metrics in real-time.
- High-Precision Results: Leverages Befar Group Co., Ltd's (601678SS) actual financial data for credible valuation analyses.
- Effortless Scenario Analysis: Easily explore various assumptions and evaluate their impacts side by side.
- Efficiency Booster: Streamlines the valuation process, removing the need to manually create complicated models.
How It Functions
- Download: Obtain the pre-configured Excel file containing Befar Group Co., Ltd's financial data.
- Customize: Tailor your forecasts, including revenue growth, EBITDA percentage, and WACC.
- Automatic Updates: The intrinsic value and NPV calculations refresh in real-time.
- Scenario Testing: Generate various projections and instantly compare results.
- Informed Decisions: Leverage the valuation outcomes to shape your investment approach.
Why Opt for Befar Group Co., Ltd (601678SS) Calculator?
- Save Valuable Time: Skip the hassle of building a DCF model from the ground up – it's ready for immediate use.
- Enhance Accuracy: Dependable financial data and calculations minimize valuation errors.
- Completely Customizable: Adjust the model to align with your unique assumptions and forecasts.
- User-Friendly Insights: Intuitive charts and outputs simplify result analysis.
- Preferred by Professionals: Crafted for experts who prioritize precision and efficiency.
Who Can Benefit from Befar Group Co., Ltd. (601678SS)?
- Investors: Assess Befar Group's valuation when considering stock purchases or sales.
- CFOs and Financial Analysts: Enhance valuation procedures and evaluate forecasts effectively.
- Startup Founders: Understand the valuation methods of established companies like Befar Group.
- Consultants: Create detailed valuation reports to provide value to clients.
- Students and Educators: Utilize real-time data for practicing and teaching valuation strategies.
What the Template Includes
- In-Depth DCF Model: Editable template featuring comprehensive valuation calculations.
- Actual Financial Data: Befar Group's historical and projected financials preloaded for thorough analysis.
- Adjustable Parameters: Customize WACC, growth rates, and tax assumptions to explore different scenarios.
- Complete Financial Statements: Detailed annual and quarterly breakdowns for enhanced insights.
- Essential Ratios: Integrated analysis for profitability, efficiency, and leverage metrics.
- Dashboard with Visual Insights: Graphs and tables presenting clear, actionable results.
Disclaimer
All information, articles, and product details provided on this website are for general informational and educational purposes only. We do not claim any ownership over, nor do we intend to infringe upon, any trademarks, copyrights, logos, brand names, or other intellectual property mentioned or depicted on this site. Such intellectual property remains the property of its respective owners, and any references here are made solely for identification or informational purposes, without implying any affiliation, endorsement, or partnership.
We make no representations or warranties, express or implied, regarding the accuracy, completeness, or suitability of any content or products presented. Nothing on this website should be construed as legal, tax, investment, financial, medical, or other professional advice. In addition, no part of this site—including articles or product references—constitutes a solicitation, recommendation, endorsement, advertisement, or offer to buy or sell any securities, franchises, or other financial instruments, particularly in jurisdictions where such activity would be unlawful.
All content is of a general nature and may not address the specific circumstances of any individual or entity. It is not a substitute for professional advice or services. Any actions you take based on the information provided here are strictly at your own risk. You accept full responsibility for any decisions or outcomes arising from your use of this website and agree to release us from any liability in connection with your use of, or reliance upon, the content or products found herein.