
|
Tianjin You FA Steel Pipe Group Stock Co., Ltd. (601686.SS) Valation DCF |
Entièrement Modifiable: Adapté À Vos Besoins Dans Excel Ou Sheets
Conception Professionnelle: Modèles Fiables Et Conformes Aux Normes Du Secteur
Pré-Construits Pour Une Utilisation Rapide Et Efficace
Compatible MAC/PC, entièrement débloqué
Aucune Expertise N'Est Requise; Facile À Suivre
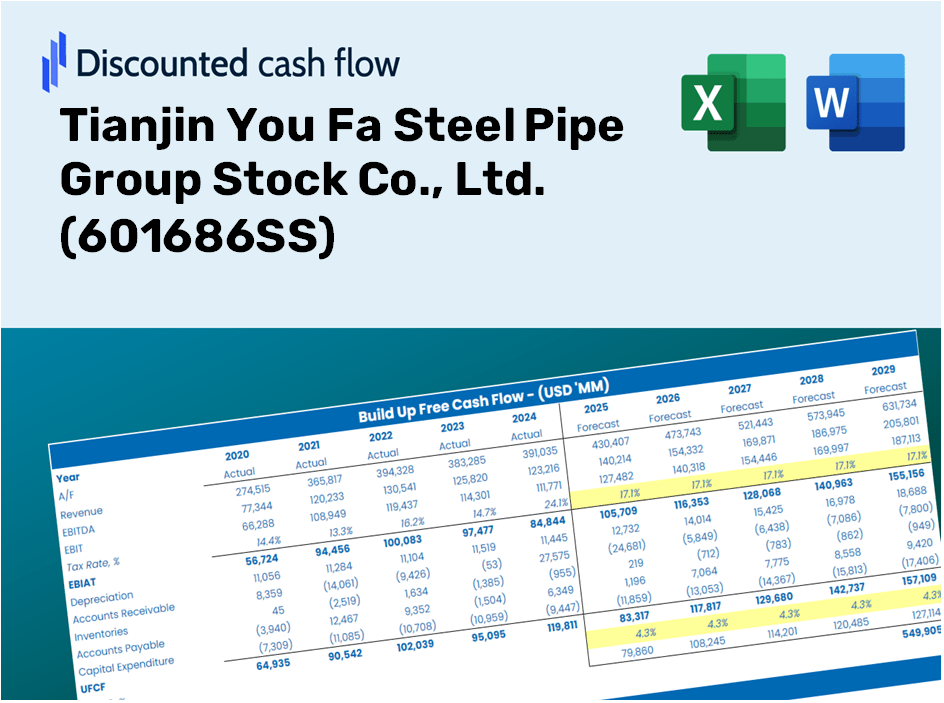
Tianjin You Fa Steel Pipe Group Stock Co., Ltd. (601686.SS) Bundle
Rationalisez votre analyse et améliorez la précision avec notre calculatrice DCF [601686SS]! Équipée des données réelles de Tianjin You FA Steel Pipe Group Stock Co., Ltd. et des hypothèses personnalisables, cet outil vous permet de prévoir, analyser et valoriser [la société] comme un investisseur expert.
Discounted Cash Flow (DCF) - (USD MM)
| Year | AY1 2020 |
AY2 2021 |
AY3 2022 |
AY4 2023 |
AY5 2024 |
FY1 2025 |
FY2 2026 |
FY3 2027 |
FY4 2028 |
FY5 2029 |
|---|---|---|---|---|---|---|---|---|---|---|
| Revenue | 48,418.7 | 66,866.0 | 67,360.4 | 60,918.2 | 54,822.1 | 57,462.9 | 60,230.9 | 63,132.3 | 66,173.4 | 69,361.0 |
| Revenue Growth, % | 0 | 38.1 | 0.73928 | -9.56 | -10.01 | 4.82 | 4.82 | 4.82 | 4.82 | 4.82 |
| EBITDA | 1,898.7 | 1,288.9 | 1,023.3 | 1,478.0 | 1,440.1 | 1,427.5 | 1,496.3 | 1,568.3 | 1,643.9 | 1,723.1 |
| EBITDA, % | 3.92 | 1.93 | 1.52 | 2.43 | 2.63 | 2.48 | 2.48 | 2.48 | 2.48 | 2.48 |
| Depreciation | 234.9 | 317.9 | 441.9 | 533.0 | 565.9 | 405.0 | 424.5 | 445.0 | 466.4 | 488.9 |
| Depreciation, % | 0.48519 | 0.4755 | 0.656 | 0.87499 | 1.03 | 0.7048 | 0.7048 | 0.7048 | 0.7048 | 0.7048 |
| EBIT | 1,663.7 | 970.9 | 581.4 | 945.0 | 874.1 | 1,022.5 | 1,071.8 | 1,123.4 | 1,177.5 | 1,234.2 |
| EBIT, % | 3.44 | 1.45 | 0.86315 | 1.55 | 1.59 | 1.78 | 1.78 | 1.78 | 1.78 | 1.78 |
| Total Cash | 4,304.1 | 3,803.2 | 3,897.4 | 3,890.1 | 12,753.0 | 5,747.6 | 6,024.5 | 6,314.7 | 6,618.8 | 6,937.7 |
| Total Cash, percent | .0 | .0 | .0 | .0 | .0 | .0 | .0 | .0 | .0 | .0 |
| Account Receivables | 454.1 | 713.9 | 998.5 | 1,861.1 | 1,720.4 | 1,112.6 | 1,166.2 | 1,222.4 | 1,281.3 | 1,343.0 |
| Account Receivables, % | 0.93778 | 1.07 | 1.48 | 3.06 | 3.14 | 1.94 | 1.94 | 1.94 | 1.94 | 1.94 |
| Inventories | 2,766.6 | 3,676.7 | 2,839.8 | 3,485.2 | 3,322.2 | 3,127.1 | 3,277.7 | 3,435.6 | 3,601.1 | 3,774.6 |
| Inventories, % | 5.71 | 5.5 | 4.22 | 5.72 | 6.06 | 5.44 | 5.44 | 5.44 | 5.44 | 5.44 |
| Accounts Payable | 2,172.3 | 4,359.0 | 3,041.5 | 4,632.1 | 13,319.6 | 5,449.8 | 5,712.4 | 5,987.5 | 6,276.0 | 6,578.3 |
| Accounts Payable, % | 4.49 | 6.52 | 4.52 | 7.6 | 24.3 | 9.48 | 9.48 | 9.48 | 9.48 | 9.48 |
| Capital Expenditure | -639.0 | -2,347.1 | -1,472.7 | -413.3 | -424.0 | -973.2 | -1,020.1 | -1,069.2 | -1,120.7 | -1,174.7 |
| Capital Expenditure, % | -1.32 | -3.51 | -2.19 | -0.67844 | -0.77344 | -1.69 | -1.69 | -1.69 | -1.69 | -1.69 |
| Tax Rate, % | 38.24 | 38.24 | 38.24 | 38.24 | 38.24 | 38.24 | 38.24 | 38.24 | 38.24 | 38.24 |
| EBITAT | 1,212.9 | 714.4 | 340.7 | 716.8 | 539.8 | 700.8 | 734.6 | 770.0 | 807.0 | 845.9 |
| Depreciation | ||||||||||
| Changes in Account Receivables | ||||||||||
| Changes in Inventories | ||||||||||
| Changes in Accounts Payable | ||||||||||
| Capital Expenditure | ||||||||||
| UFCF | -239.6 | -298.1 | -1,455.2 | 919.2 | 9,672.9 | -6,934.2 | 197.3 | 206.8 | 216.7 | 227.2 |
| WACC, % | 6.15 | 6.16 | 5.93 | 6.2 | 5.98 | 6.09 | 6.09 | 6.09 | 6.09 | 6.09 |
| PV UFCF | ||||||||||
| SUM PV UFCF | -5,847.7 | |||||||||
| Long Term Growth Rate, % | 2.00 | |||||||||
| Free cash flow (T + 1) | 232 | |||||||||
| Terminal Value | 5,671 | |||||||||
| Present Terminal Value | 4,220 | |||||||||
| Enterprise Value | -1,627 | |||||||||
| Net Debt | -9,360 | |||||||||
| Equity Value | 7,732 | |||||||||
| Diluted Shares Outstanding, MM | 1,416 | |||||||||
| Equity Value Per Share | 5.46 |
What You Will Receive
- Flexible Forecast Inputs: Effortlessly adjust key assumptions (growth %, profit margins, WACC) to explore various scenarios.
- Industry-Specific Data: Pre-loaded financial data for Tianjin You Fa Steel Pipe Group Stock Co., Ltd. (601686SS) to kickstart your analysis.
- Automated DCF Outputs: The template provides calculated Net Present Value (NPV) and intrinsic value automatically.
- Customizable and Professional Design: A refined Excel model tailored to fit your valuation requirements.
- Designed for Analysts and Investors: Perfect for evaluating projections, confirming strategies, and enhancing efficiency.
Key Features
- Customizable Financial Inputs: Adjust essential parameters such as production capacity, cost of raw materials, and market growth rates.
- Instant DCF Valuation: Quickly determines intrinsic value, NPV, and related metrics at the click of a button.
- High-Precision Accuracy: Utilizes Tianjin You Fa's actual financial data for dependable valuation results.
- Effortless Scenario Testing: Easily explore various assumptions and analyze different outcomes.
- Efficiency Booster: Avoid the hassle of constructing elaborate valuation models from the ground up.
How It Works
- Step 1: Download the Excel file for Tianjin You Fa Steel Pipe Group Stock Co., Ltd. (601686SS).
- Step 2: Examine the pre-filled financial data and forecasts specific to Tianjin You Fa.
- Step 3: Adjust key inputs such as revenue growth, WACC, and tax rates (highlighted cells).
- Step 4: Observe the DCF model update in real-time as you refine your assumptions.
- Step 5: Evaluate the outputs and leverage the results for your investment strategies.
Why Select Tianjin You Fa Steel Pipe Group Stock Co., Ltd. (601686SS)?
- Time-Efficient: No need to build intricate financial models from the ground up – our solutions are readily available.
- Enhanced Accuracy: Dependable financial data and robust formulas minimize valuation errors.
- Completely Customizable: Adapt our models to align with your specific assumptions and forecasts.
- User-Friendly: Intuitive charts and outputs ensure the results are straightforward to assess.
- Preferred by Professionals: Crafted for experts who prioritize both precision and functionality.
Who Should Utilize This Product?
- Investors: Evaluate Tianjin You Fa Steel Pipe Group Stock Co., Ltd. (601686SS) for informed buying or selling decisions.
- CFOs and Financial Analysts: Enhance valuation workflows and validate financial forecasts.
- Startup Founders: Gain insights into the valuation methodologies of established companies like Tianjin You Fa Steel Pipe Group Stock Co., Ltd. (601686SS).
- Consultants: Create comprehensive valuation reports tailored for your clients.
- Students and Educators: Apply real-world case studies to develop and teach valuation strategies.
Contents of the Template
- Operating and Balance Sheet Data: Pre-filled historical data and forecasts for Tianjin You Fa Steel Pipe Group (601686SS), including revenue, EBITDA, EBIT, and capital expenditures.
- WACC Calculation: A dedicated sheet for Weighted Average Cost of Capital (WACC), featuring parameters such as Beta, risk-free rate, and share price.
- DCF Valuation (Unlevered and Levered): Customizable Discounted Cash Flow models that present intrinsic value with comprehensive calculations.
- Financial Statements: Pre-loaded annual and quarterly financial statements to facilitate thorough analysis.
- Key Ratios: A collection of profitability, leverage, and efficiency ratios specific to Tianjin You Fa Steel Pipe Group (601686SS).
- Dashboard and Charts: A visual summary of valuation outputs and underlying assumptions for easy result analysis.
Disclaimer
All information, articles, and product details provided on this website are for general informational and educational purposes only. We do not claim any ownership over, nor do we intend to infringe upon, any trademarks, copyrights, logos, brand names, or other intellectual property mentioned or depicted on this site. Such intellectual property remains the property of its respective owners, and any references here are made solely for identification or informational purposes, without implying any affiliation, endorsement, or partnership.
We make no representations or warranties, express or implied, regarding the accuracy, completeness, or suitability of any content or products presented. Nothing on this website should be construed as legal, tax, investment, financial, medical, or other professional advice. In addition, no part of this site—including articles or product references—constitutes a solicitation, recommendation, endorsement, advertisement, or offer to buy or sell any securities, franchises, or other financial instruments, particularly in jurisdictions where such activity would be unlawful.
All content is of a general nature and may not address the specific circumstances of any individual or entity. It is not a substitute for professional advice or services. Any actions you take based on the information provided here are strictly at your own risk. You accept full responsibility for any decisions or outcomes arising from your use of this website and agree to release us from any liability in connection with your use of, or reliance upon, the content or products found herein.